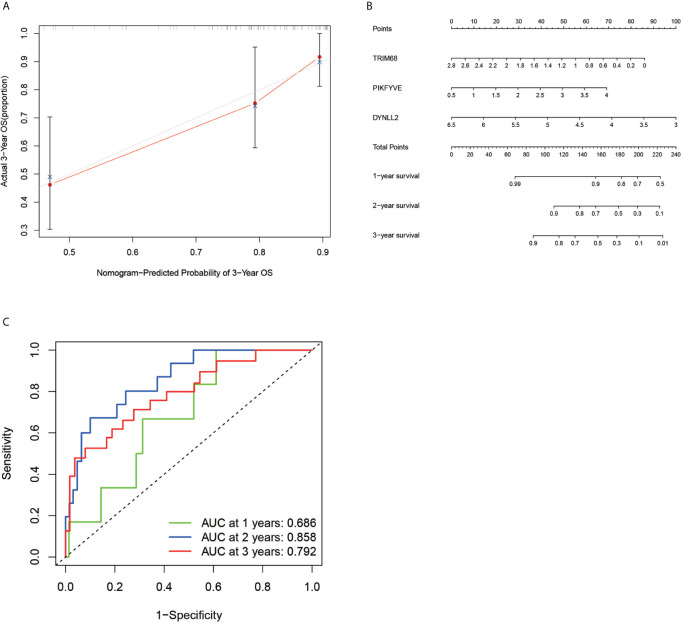
Figure 6.
Calibration plots, column line plots and ROC diagnostic curves. Plots (A, B) show the calibration plots of the model and the column line plots of the predicted prognosis, respectively. Plots (C) demonstrates the ROC curve plot for predicting prognostic accuracy, with all areas under the curve above 50%.

