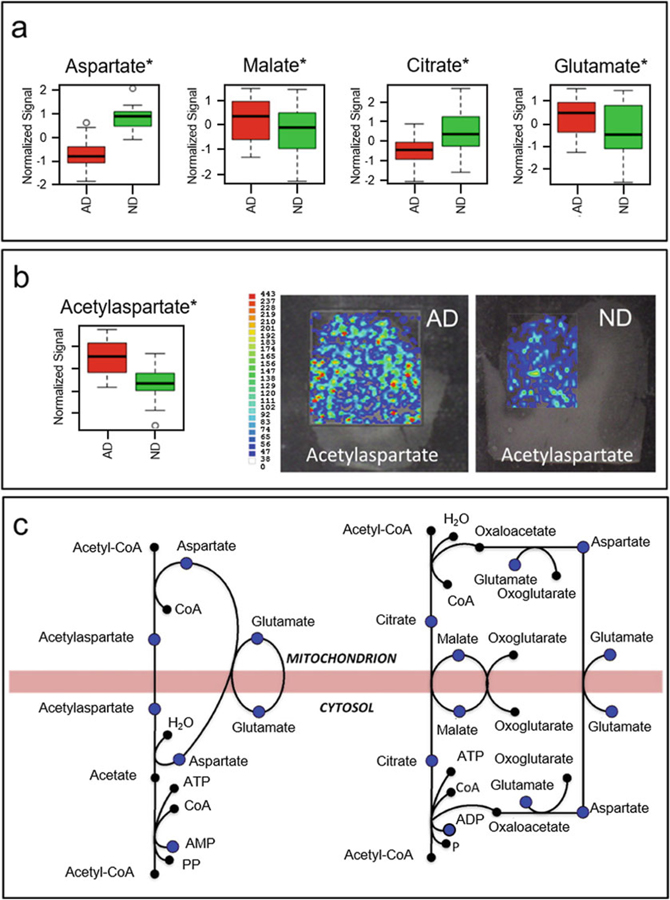
Fig. 12.
(a) Bar charts summarizing the normalized ion signal observed in IM-MS experiments for aspartate, malate, citrate, and glutamate obtained from AD (red) and ND control subjects (green). (b) N-acetylaspartate (NAA) levels between AD (red) and control subjects (green) and MS images obtained from brain sections of both AD and control subjects. (c) Mitochondrial shuttles describing the exchange of metabolites between the cytosol and mitochondria and the metabolites quantified in the IM-MS experiments (blue dots) of Paglia et al. *p < 0.05 (t test) (Figure from Paglia et al. [155])

