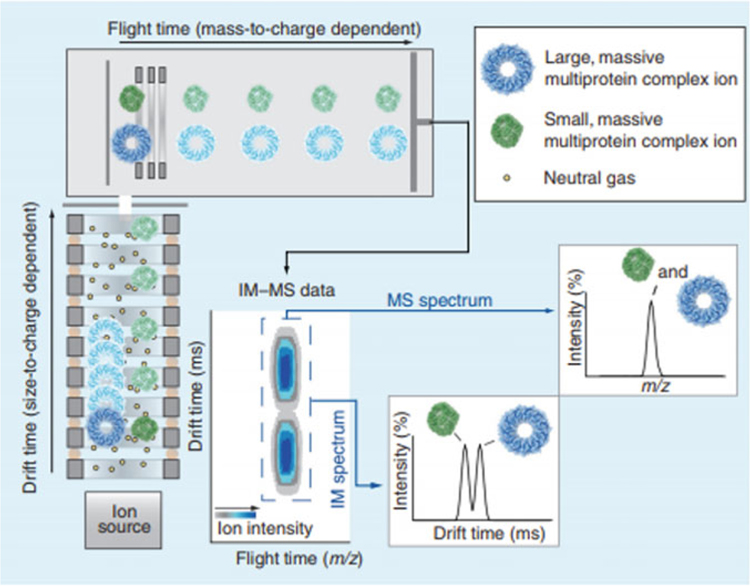
Fig. 7.
Basic principles of IM-MS data acquisition and the resulting spectra. Ions generated in the ion source (lower left) are introduced into an IM spectrometer, which is effectively an ion guide consisting of a background of neutral gas molecules and a weak electric field. Following IM analysis, the ions are introduced into a mass analyzer operated under vacuum. The resulting IM and MS data are 3-dimensional, containing ion intensity, size, and mass information, and can be projected either as a contour plot (middle, bottom), or 2D selections in either drift time or m/z space (lower right) (Figure from Zhang et al. [93])

