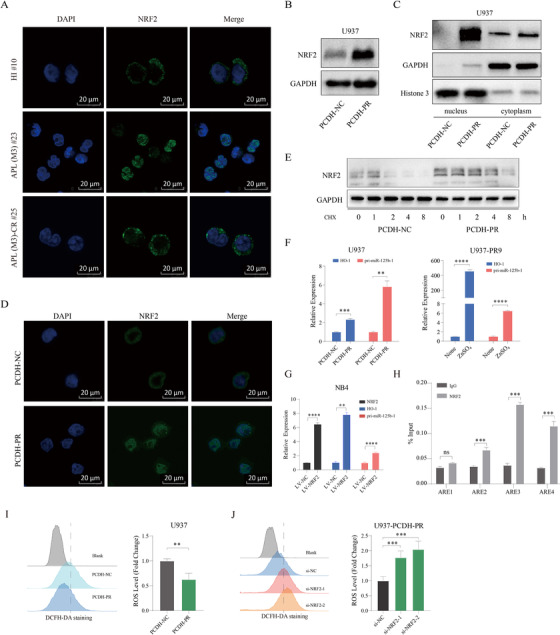
FIGURE 1.

PML‐RARα activates the NRF2/miR‐125b‐1 antioxidant program. (A) Immunofluorescence microscopy after staining with NRF2 (green) and DAPI (blue) demonstrated NRF2 expression in HI, APL (M3) and APL (M3)‐CR cells. Scale bars, 20 μm. (B and C) U937‐PCDH‐NC and U937‐PCDH‐PR cells were analyzed for NRF2 in whole cell lysates or cytosolic/nuclear fractions by Western blot. Blots are representative of at least three independent experiments. (D) Immunofluorescence microscopy of NRF2 in stable constitutive express PML‐RARA (U937‐PCDH‐PR) or negative control (U937‐PCDH‐NC) cells. A representative image of three independent experiments is shown. Scale bars, 20 μm. (E) Western blot analysis of NRF2 in U937‐PCDH‐NC and U937‐PCDH‐PR cells treated with 20 μM cycloheximide at different time points. (F) qRT‐PCR analysis of HO‐1 and pri‐miR‐125b‐1 in U937‐PCDH‐PR or U937‐PR9 (a zinc‐inducible PML‐RARA cell line derived from U937) cells. p values were obtained by unpaired Student's t test. (G) qRT‐PCR analysis of NRF2, HO‐1 and pri‐miR‐125b‐1 in NRF2‐overexpressing NB4 cells. (H) ChIP‐qPCR analysis of NB4 cells demonstrated that immunoprecipitation (IP) with an anti‐NRF2 antibody resulted in enrichment of the three putative binding sites compared with IP with a control immunoglobulin. (I) The ROS levels in U937‐PCDH‐NC and U937‐PCDH‐PR cells were measured by a DCFH‐DA probe. (J) ROS levels in U937‐PCDH‐PR cells were analyzed after knocking down the NRF2 gene. Data are presented as the means ± SD from at least three independent experiments. Detailed methods are available in Methods in the Supporting Information
