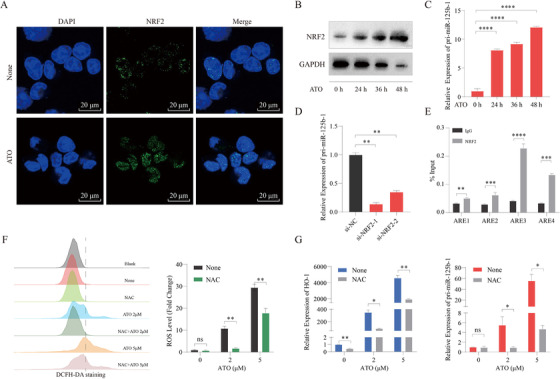
FIGURE 2.

Chemotherapeutic drug treatment‐induced activation of NRF2 leads to upregulation of miR‐125b‐1. (A) Immunofluorescence microscopy after staining with NRF2 (green) and DAPI (blue) demonstrated NRF2 expression in NB4 cells treated with 2 μM ATO for 48 h. None, untreated; Scale bars, 20 μm. (B) Western blot analysis of NRF2 in NB4 cells treated with 2 μM ATO for the indicated times. GAPDH served as loading control. (C) qRT‐PCR analysis of pri‐miR‐125b‐1 in NB4 cells treated with 2 μM ATO for the indicated times. (D) qRT‐PCR analysis of pri‐miR‐125b‐1 in NB4 cells transduced with the indicated siRNA and treated for 48 h with 2 μM ATO. (E) ChIP‐qPCR analysis of NB4 cells treated with 2 μM ATO for 48 h demonstrated that immunoprecipitation (IP) with an anti‐NRF2 antibody resulted in enrichment of the four putative binding sites compared with IP with control immunoglobulin. (F) ROS levels were assessed by flow cytometric analysis. The NB4 cells were pretreated with 5 mM NAC for 4 h and then treated with 2 μM or 5 μM ATO for 24 h. (G) qRT‐PCR analysis of HO‐1 and pri‐miR‐125b‐1 in NB4 cells. The NB4 cells were pretreated with 5 mM NAC for 4 h and then treated with 2 μM or 5 μM ATO for 24 h. The graph represents the mean and SD of three independent experiments. Results were normalized by the respective controls
