Figure 1.

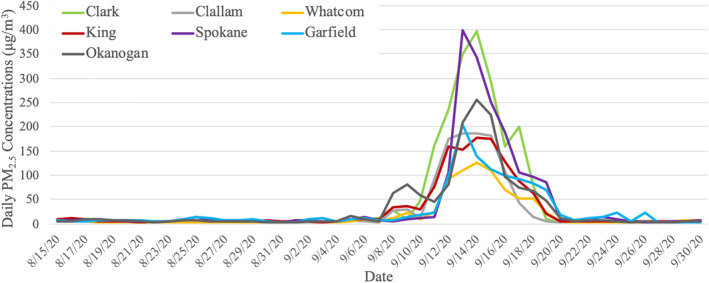
Time series plot of daily PM2.5 concentrations in selected counties before, during and after the 2020 wildfire smoke episode in Washington.

Time series plot of daily PM2.5 concentrations in selected counties before, during and after the 2020 wildfire smoke episode in Washington.