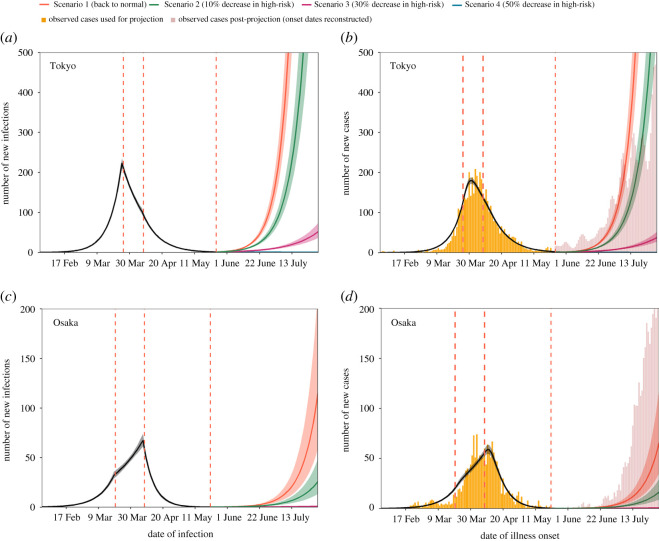
Figure 1.
Estimated and projected trajectories of COVID-19 cases by date of infection and symptom onset including cases with unknown illness onset date in Tokyo and Osaka, Japan. (a,c) Estimated and projected numbers of COVID-19 cases by date of infection in Tokyo and Osaka, using all back-projected cases (yellow bars). The temporal trend in the number of new infections by 31 May 2020 was estimated using exponential curves with three different growth rates (black) and was then projected according to four scenarios (colours). The lines denote medians, and shaded areas represent 95% credible intervals (CrIs). Red dotted lines denote the dates when we assumed the trend changed (26 March, 8 April and 25 May 2020 for Tokyo; 20 March, 8 April and 21 May 2020 for Osaka). (b,d) Observed, estimated and projected numbers of COVID-19 cases by date of illness onset in Tokyo and Osaka. Yellow bars show the observed number of cases by the date of illness onset used for the projection, and red bars show the observed number of cases in the post-projection period (25 May–30 July 2020 for Tokyo; 21 May–30 July 2020 for Osaka). A small inconsistency was observed at the connecting part between the two time series because the post-prediction data lacked dates of illness onset, which were thus all reconstructed by the back-projection method from dates of laboratory confirmation. The estimated (black) and projected (colours) numbers of cases and their 95% CrIs are shown as lines and shaded areas, respectively.

