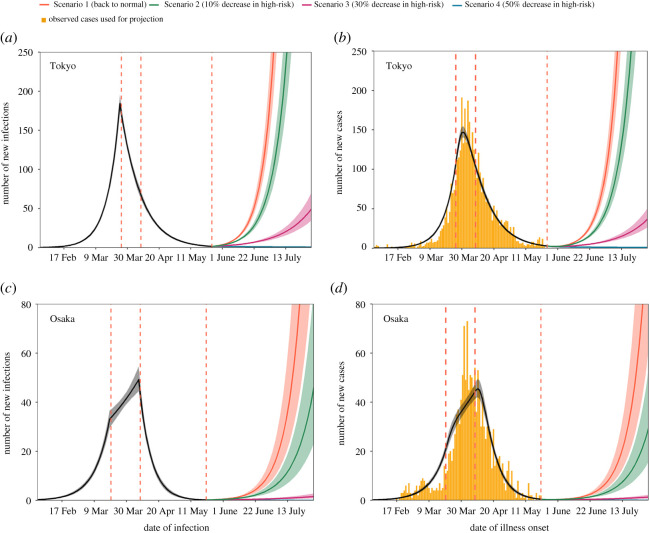
Figure 2.
Estimated and projected trajectories of COVID-19 cases by date of infection and symptom onset, excluding cases with unknown illness onset in Tokyo and Osaka, Japan. (a,c) Estimated and projected numbers of COVID-19 cases by date of infection without back-projected cases in Tokyo and Osaka. The temporal trend in the number of new infections by 31 May 2020 was estimated using exponential curves with three different growth rates (black) and was then projected according to four scenarios (colours). The lines denote medians, and shaded areas represent 95% credible intervals (CrIs). Red dotted lines denote the dates when we assumed the trend changed (26 March, 8 April and 25 May 2020 for Tokyo; 20 March, 8 April and 21 May 2020 for Osaka). (b,d) Observed, estimated and projected numbers of COVID-19 cases by date of illness onset in Tokyo and Osaka. The bars show the observed number of cases by illness onset. The estimated (black) and projected (colours) numbers of cases and their 95% CrIs are shown as lines and shaded areas, respectively.

