
Figure 5. Intratumoral innate immune cell profile following CPMV microneedle administration.
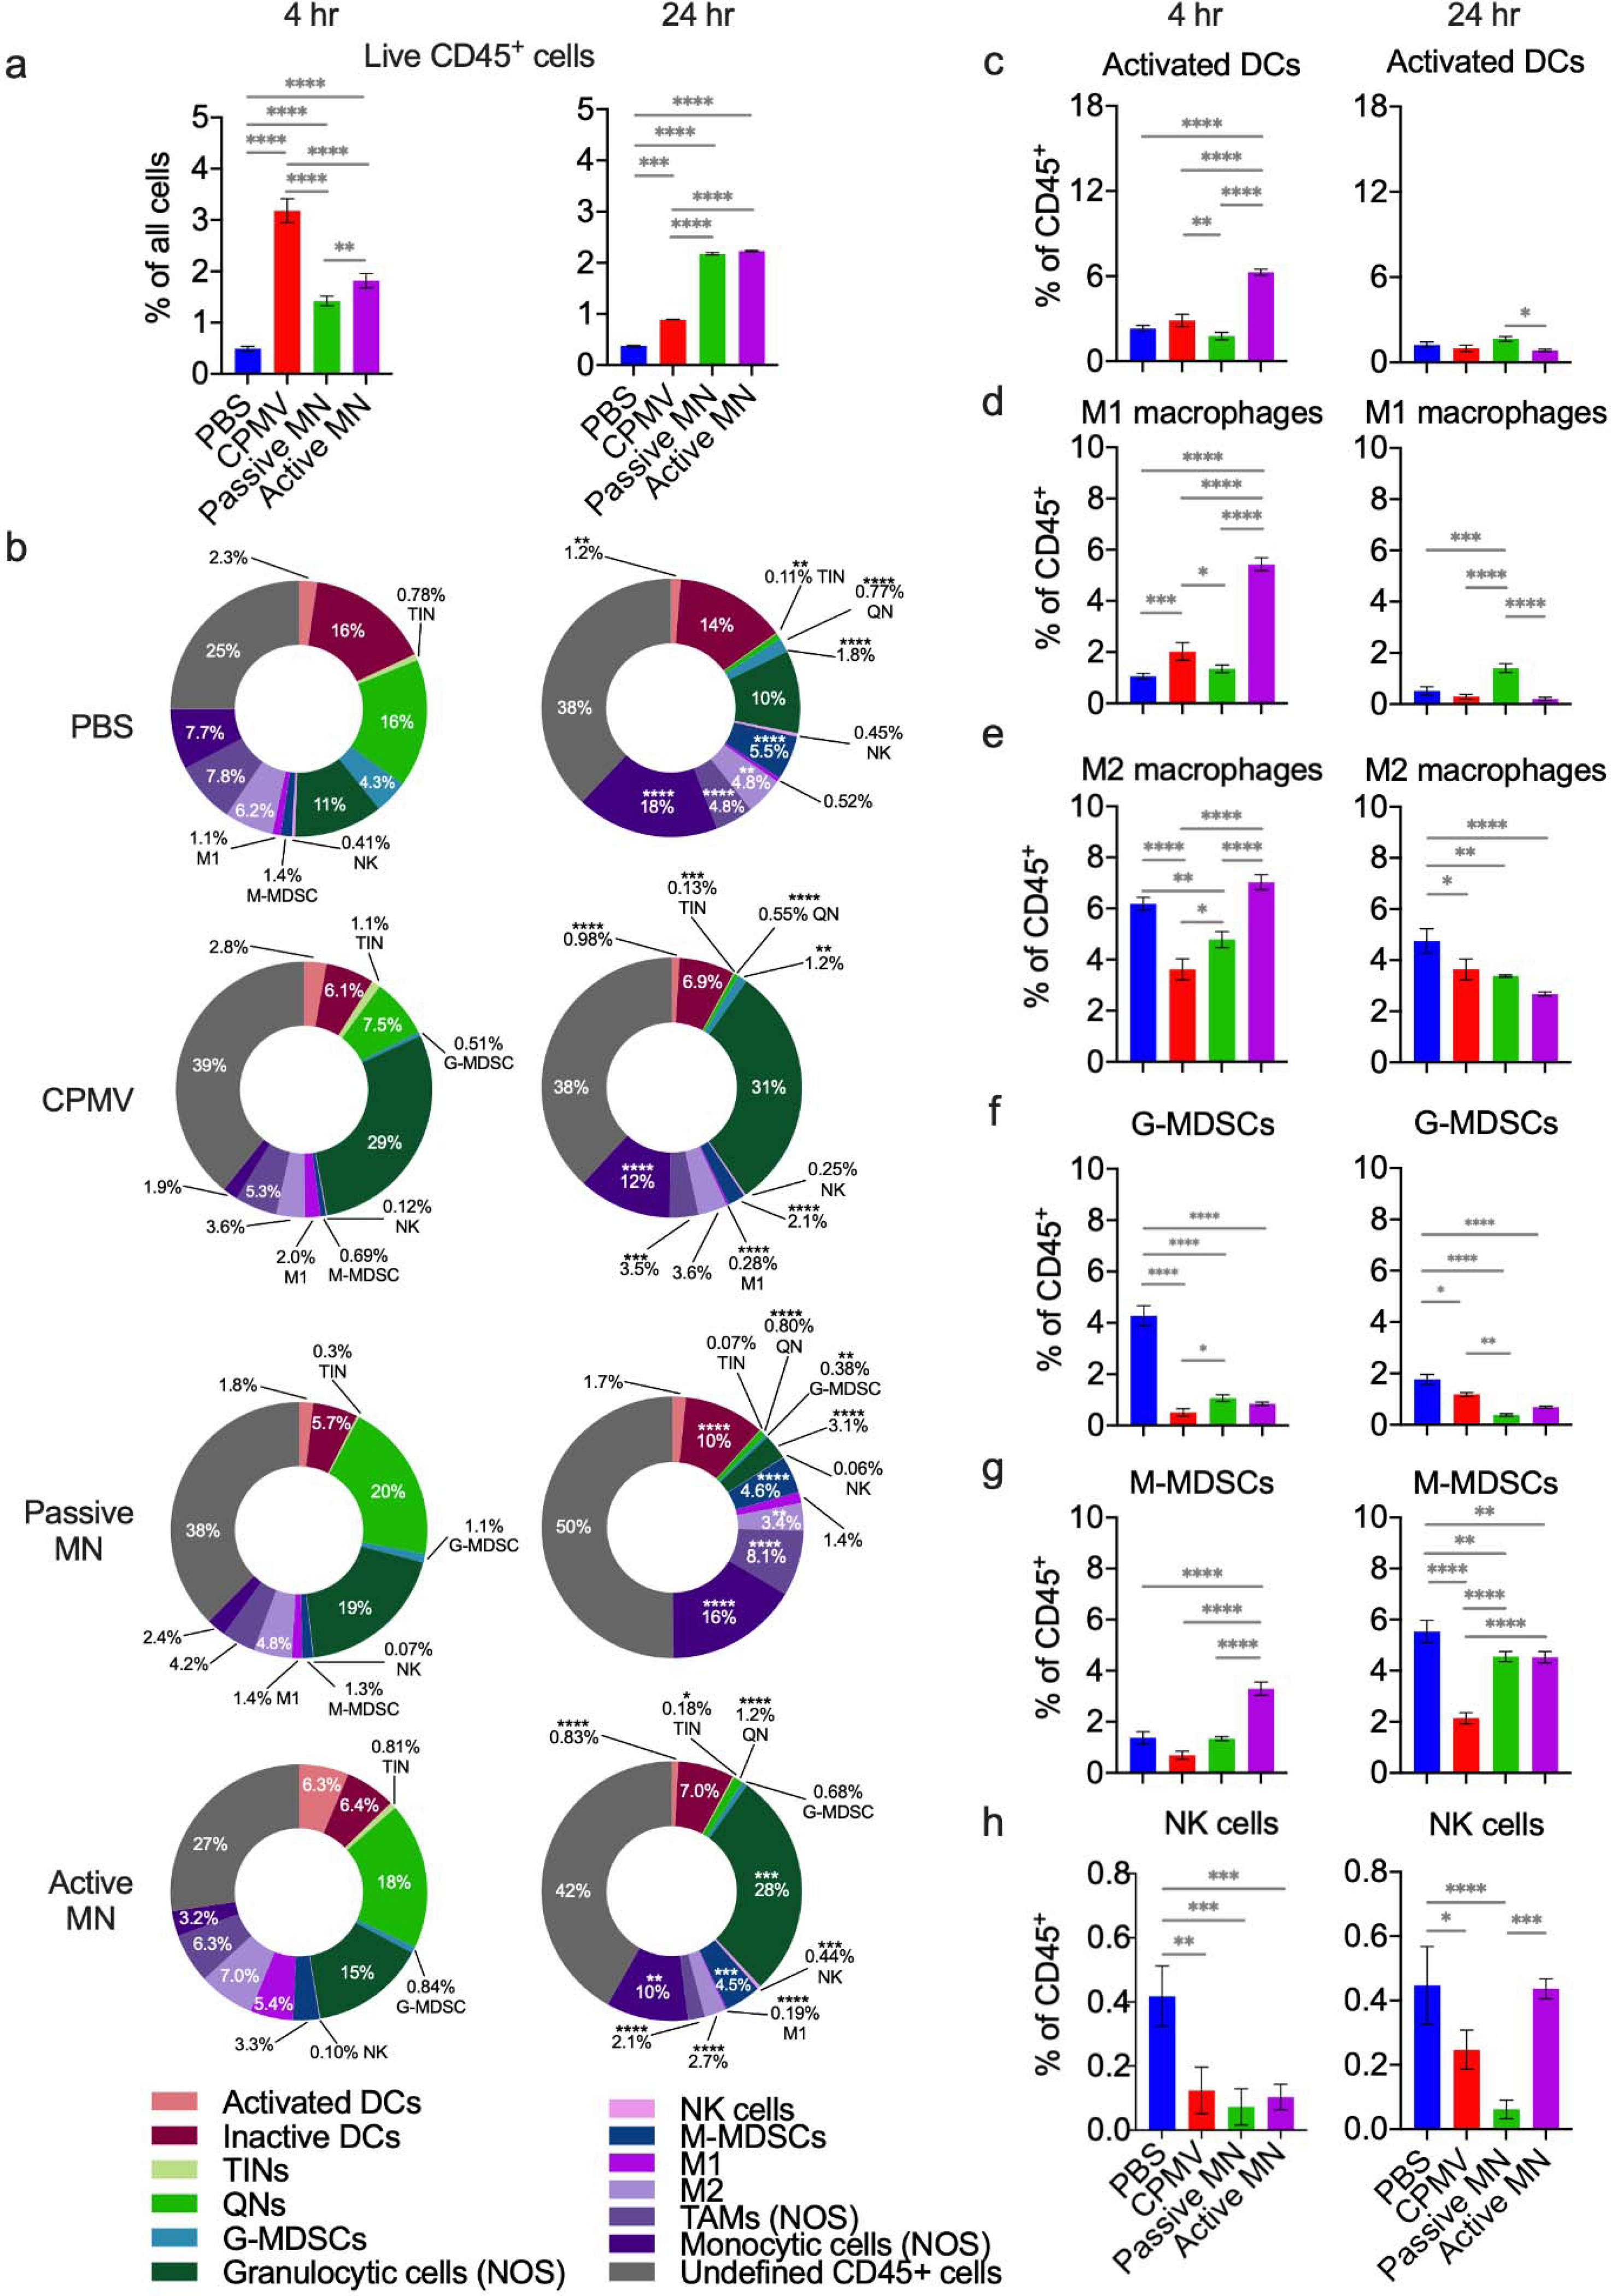
C57BL/6 mice bearing dermal B16F10 tumors (60 mm3) were treated with CPMV by intratumoral injection, passive MN, or active MN. Four hours and 24 hours following treatment, the tumors were harvested to quantify innate immune cell infiltration by flow cytometry. (a) Percentage of total cells analyzed that were CD45+ at 4 hours (left) and 24 hours (right) after treatment. (b) Innate immune tumor infiltrate profiles (% of CD45+ cells) at 4 hours (left column) and 24 hours (right column). Data are mean percent (n=3). (c-h) Percentages of intratumoral CD45+ cells consisting of activated dendritic cells (DCs, c), type 1 tumor associated macrophages (M1 macrophages, d), type 2 tumor associated macrophages (M2 macrophages, e), granulocytic myeloid-derived suppressive cells (G-MDSCs, f), monocytic-myeloid derived suppressive cells (M-MDSCs, g), and natural killer cells (NK cells, h). Data are means ± SD (n=3). Statistical significance was calculated using two-way ANOVA (Treatment type vs. Time) with Sidak’s multiple comparisons post-test: *P<0.05, **P<0.01, ***P<0.001, ****P<0.0001. Abbreviations: DCs, dendritic cells; TINs, tumor-infiltrating neutrophils; QNs, quiescent neutrophils; G-MDSCs, granulocytic-myeloid derived suppressive cells; NK, natural killer, M-MDSCs, monocytic-myeloid derived suppressive cells; TAMs, tumor-associated macrophages; NOS, not otherwise specified.