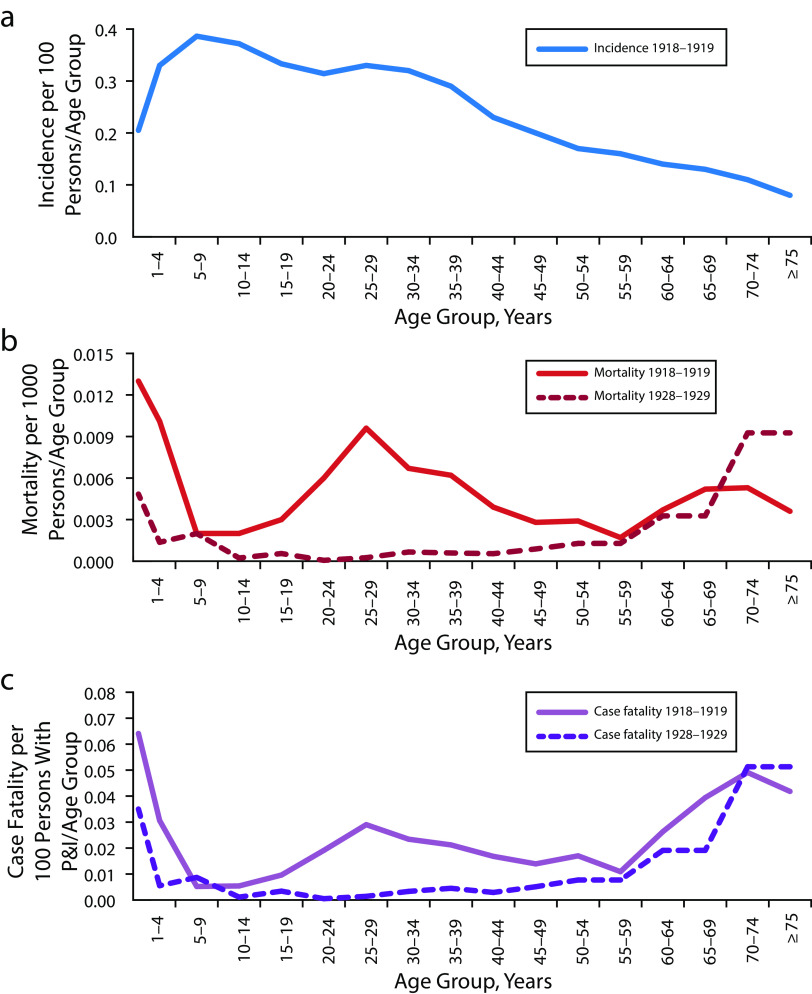
FIGURE 4—
Age-Specific Morbidity and Mortality of Influenza in 1918–1919 and, for Comparison, in 1928–1929, as Determined by US “P and I” Data by (a) Incidence per 100 Persons Ill With Pneumonia and Influenza per Age Group; (b) Mortality per 1000 Persons per Age Group; and (c) Case‒Fatality
Source. Morens and Taubenberger.49
Note. P and I = pneumonia and influenza. Parts b and c compare the W-shaped curves of age-specific mortality and case‒fatality seen in 1918–1919 with more typical U-shaped curves from 1928 to 1929. Between 1889 and the present time, U-shaped curves have been seen in all pandemics and seasonal epidemics except for 1918 and the several years thereafter. Morbidity and mortality data reflecting diagnoses of pneumonia and influenza (so-called “P and I”) are still widely used today for epidemiological purposes (e.g., for estimating total influenza deaths during periods of influenza prevalence) because incomplete morbidity reporting and imperfect death certificate accuracy greatly underestimate infections and deaths from influenza and its secondary bacterial complications. National or large-population data permitting similar calculations for COVID-19 are not yet available, although preliminary data suggest that age-specific mortality is very low in infants and children, rising regularly with age thereafter.

