
Fig 2.
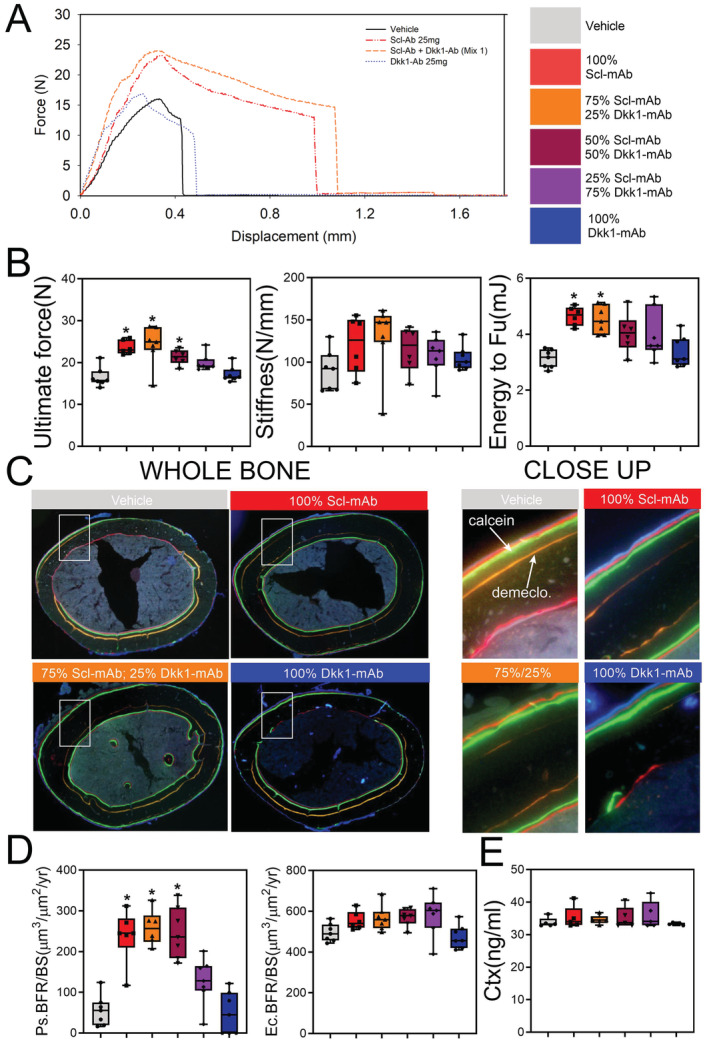
Cortical bone mechanical properties and formation indices are not improved by combination sclerostin/Dkk1 antibody therapy. (A) Representative force‐displacement curves from three‐point monotonic bending tests to failure conducted on whole femurs from 16‐week‐old mice treated with vehicle, Scl‐mAb alone, Dkk1‐mAb alone, or a 3:1 cocktail of Scl‐mAb/Dkk1‐mAb (remaining groups were omitted from panel for clarity). (B) Quantification of ultimate force (peak height of the curve in panel A), stiffness (slope of the linear portion of the curve in panel A), and energy absorbed (area under the curve in A). (C) Representative fluorochrome‐labeled midshaft femur histologic cross sections from mice treated as described for panel A. The ROI box in the whole‐bone panels is magnified in the right panels to visualize bone formation between the demeclocycline (orange) label and the calcein (green) label. Alizarin (red) labels were injected but not used for measurements. See Fig. 1A for labeling schedule. (D) Quantification of anabolic action on the periosteal (Ps) and endocortical (Ec) surfaces, measured using the demeclocycline and calcein labels (Alizarin labels were not used for measurements), and presented as the bone formation rate per unit bone surface (BFR/BS). Mineralizing surface and mineral apposition rates are given in Supplementary Fig. S2. (E) Quantification of serum concentration of C‐terminal telopeptide (CtX) from all treatment groups at 12 weeks of age. *p < 0.05 versus vehicle; n = 6–7 mice/group.