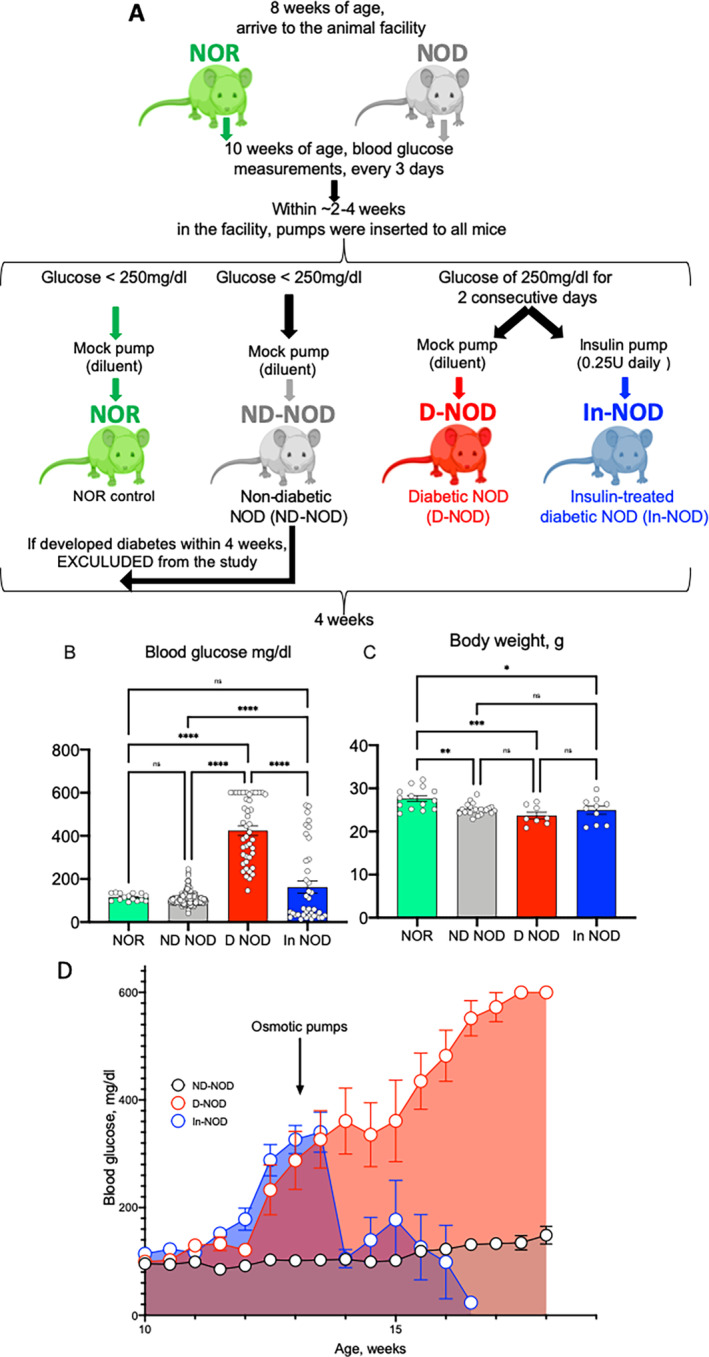
Fig. 1.

Nonobese diabetic (NOD) mice exhibit fourfold elevations in blood glucose and decreased body weight. (A) Schematic presentation of the experimental design. (B) Blood glucose levels measured throughout the study. (C) Body weight recorded at the end of the study. (D) Longitudinal measurements of blood glucose. Values are given as mean ± SEM; and *p < 0.05 considered significant (nonobese diabetic‐resistant [NOR], n = 14; nondiabetic NOD mice [ND‐NOD], n = 19; diabetic NOD [D‐NOD], n = 8, insulin‐treated [In‐NOD], n = 10).
