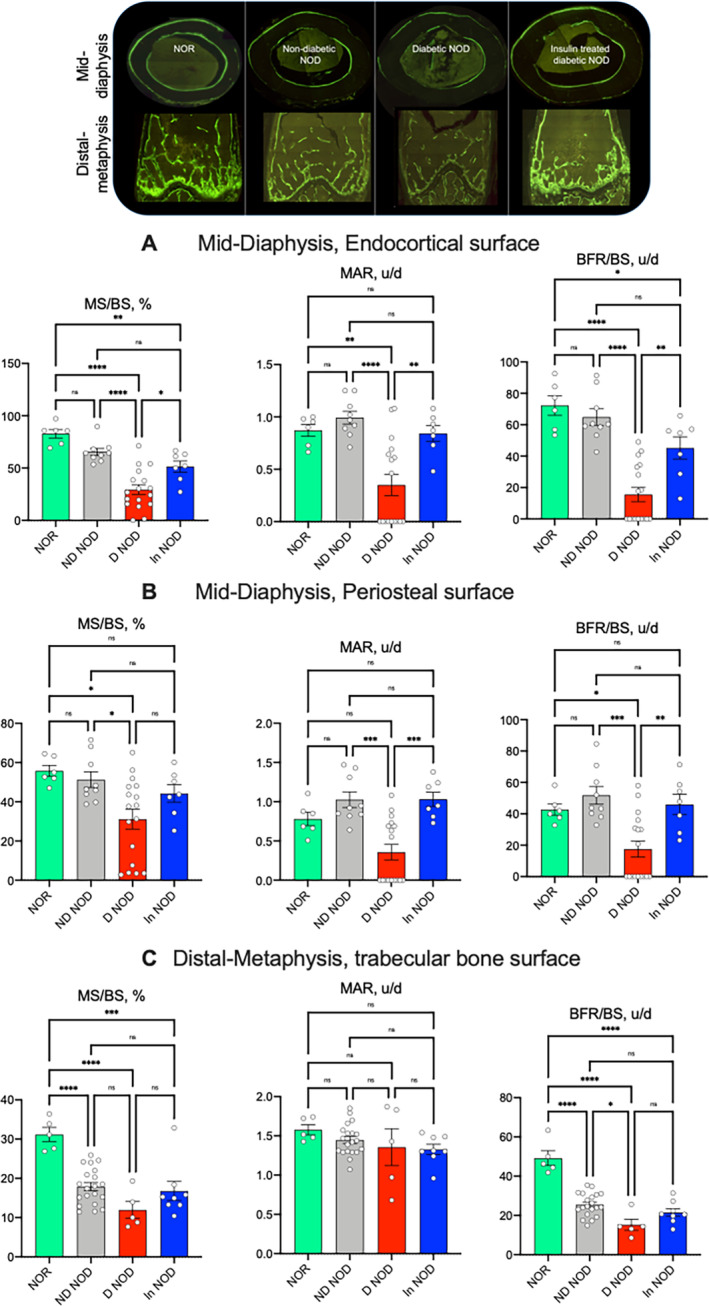
Fig. 5.

Diabetic NOD mice exhibit inhibited bone formation. Dynamic bone indices were determined by histomorphometry of bones from mice injected with calcein at 7 days distance. Cortical bone formation indices were taken at the endocortical surface (A) and the periosteal surface (B) of the femur mid‐diaphysis included mineral surface to bone surface (MS/BS) ratio, mineral apposition rate (MAR), and bone formation rate (BFR). (C) Similar indices were taken of the trabecular bone compartment at the femur distal metaphysis. Each dot on the bar graph represents one sample. Values are given as mean ± SEM; *p < 0.05 was considered significant. D‐NOD, diabetic NOD; In‐NOD, insulin‐treated NOD; ND‐NOD, nondiabetic NOD; NOD, nonobese diabetic; NOR, nonobese diabetic‐resistant
