Figure 6.
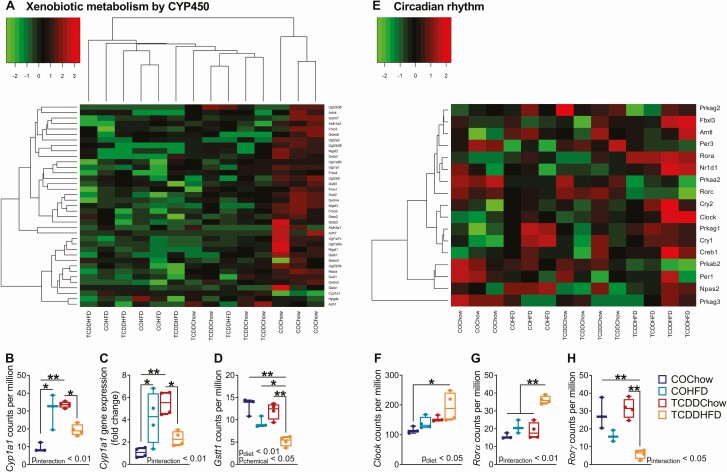
TCDDHFD females have inappropriate Cyp1a1 and circadian rhythm gene expression. Islets were isolated from females at week 12 of the study for TempO-Seq® and qPCR analysis (n = 3-4/group) (see Fig. 1A for study timeline). (A) Hierarchical heatmap showing expression of genes involved in the “Xenobiotic Metabolism by CYP450” pathway. (E) Heatmap arranged by experimental group showing expression of genes involved in “Circadian Rhythm.” (B, D, F-H) Gene expression of (B) Cyp1a1, (D) Gsst1, (F) Clock, (G) Rorα, and (H) Rorγ in counts per million measured by TempO-Seq analysis. (C) Cyp1a1 gene expression measured by qPCR analysis. Individual data points on box and whisker plots represent biological replicates (different mice). All data are presented as median with min/max values. *P < 0.05, **P < 0.01. The following statistical test was used: (C-G) two-way ANOVA with Tukey’s multiple comparison test.

