Figure 7.
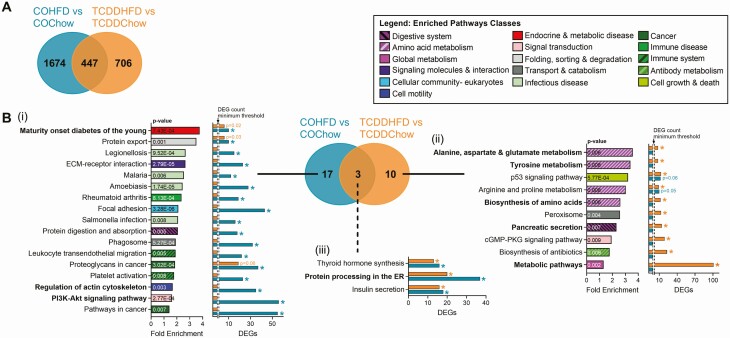
TCDD exposure promotes HFD-induced changes in amino acid metabolism genes in islets. Islets were isolated from females at week 12 of the study for TempO-Seq® analysis (n = 3-4/group) (see Fig. 1A for study timeline). (A) Venn diagram displaying differentially expressed genes (DEGs) (adjusted P < 0.05, absolute fold change ≥ 1.5) in HFD-fed females relative to their respective chow-fed control female. (B) KEGG pathway analysis was performed on all the DEGs for each comparison shown in (A). Results are displayed as a Venn diagram to show pathways that are unique to (i) COHFD and (ii) TCDDHFD, and (iii) to show pathway overlap between experimental groups. For specific pathways, bar graph show pathway fold enrichment in each HFD-fed group with respect to their chow-fed control (DAVID modified Fisher Extract P value < 0.01 relative to respective chow-fed control), and DEG counts for statistically enriched pathways (colored * = modified Fisher Extract P value < 0.01 vs chow-fed control). Pathways that were not trending or statistically enriched are indicated on bar graphs as not having the DEG count minimum threshold for significance.

