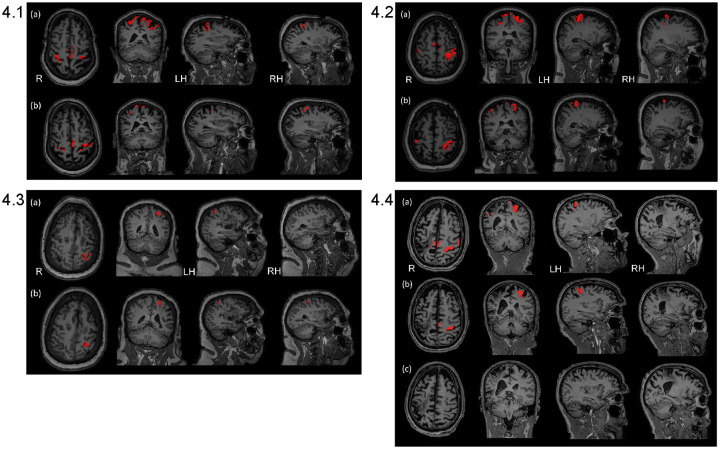
Fig 4. Brain map outcome measures acquired at pre-treatment and follow-up.
Brain maps are shown for right and left hemisphere regions: HK, BA4—HK, BA3, and BA6) reflecting the summary results in Table 3 above for pre-treatment and follow-up. (FWEc, p value = 0.05 with small volume correction, used for thresholding each ROI). Key: R = right hemisphere; LH = left hemisphere; RH = right hemisphere. Individual activation values are in the S1 File, Section I. Outcome Measures, Section 1.2. fMRI Outcome Measures, Individual Subject Data; Table 2a-2d in S1 File. 4.1. Subject 1. S1 in S1 File showed lessening of activation from pre-treatment to follow-up in all ROIs. 4.2. Subject 2. S2 in S1 File showed lessening of activation in all ROIs from pre-treatment to follow-up, except for right sensory region which remained consistent. 4.3. Subject 3. S3 in S1 File showed increases in all left lesioned hemisphere ROIs, except sensory which decreased minimally; there was an increase in right Primary Motor-Hand Knob and all other ROIs remained consistent or with only minimal change. 4.4. Subject 4. S4 in S1 File. For S4 in S1 File, from pre-treatment to post-treatment in the right lesioned hemisphere, there was a 26% decrease for the sensory region, with zero or near zero for the remaining right ROIs. For the left hemisphere, there was a decrease in all ROIs, except for a minimal increase in the Hand Knob region.

