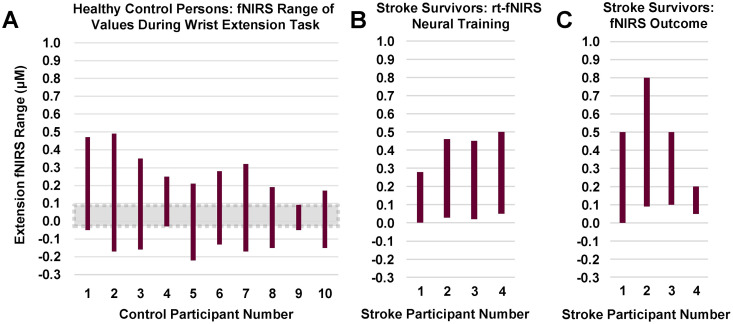
Fig 5. fNIRS: Range of values for ‘active–rest’ hemoglobin concentration during wrist extension task three conditions, all during wrist extension task.
Panel A. Healthy controls fNIRS range of values during wrist extension. Panel B. Stroke survivors during rt-fNIRS training for wrist extension. Panel C. Stroke survivors during wrist extension without neural feedback (pre-, post-treatment, follow-up. Key: Each vertical bar shows the range of HbO for a given individual, each of whom are identified on the horizontal axis. For y-axis, oxyhemoglobin concentration values were calculated as the difference between ‘active-rest’ condition. This difference variable is a change in oxyhemoglobin concentration from rest to the active movement state, derived from the fNIRS signal. The above rectangles for each participant represent the range of values for that given participant. *Data for healthy controls and S1 were acquired using Hitachi fNIRS system and data for S2, S3, and S4 were acquired using the NIRx fNIRS system.

