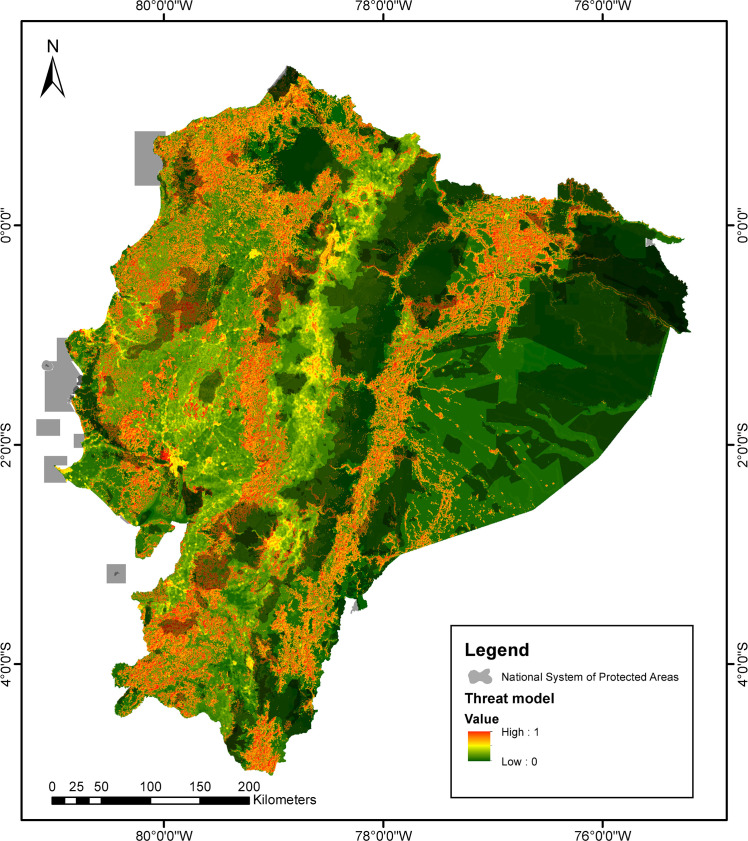
Fig 4. High resolution (30 m x 30 m) Environmental Risk Surface (ERS) model for Ecuadorian amphibians.
Values of the ERS range from 0 (Green, low) to 1 (Red, high) to represent threat intensity. Shaded areas correspond to the National System of Protected areas shown in Fig 1.

