
Figure 3.
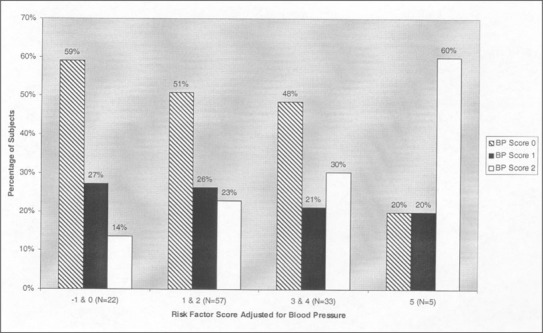
Male subjects are presented according to blood pressure (BP) status and BP‐adjusted cardiovascular risk score. Normotensive cases are depicted by the slashed bar; high‐normal cases are represented by the black bar; hypertensive cases are represented by the white bar. The portion of hypertensive cases is greatest at the higher adjusted risk score. The reverse occurs among normotensives, with more cases at the lower risk scores.