
Figure 2.
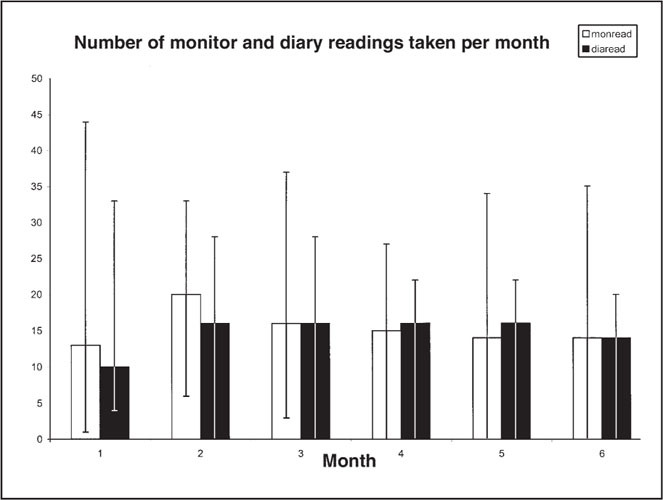
Monthly median monitor‐recorded and self‐reported (diary) blood pressure readings. In this plot, the short, wide bars represent the median number of readings per month. The long, thin, extending lines represent the 10th to 90th percentile range of these median values for the 49 patients in our study.