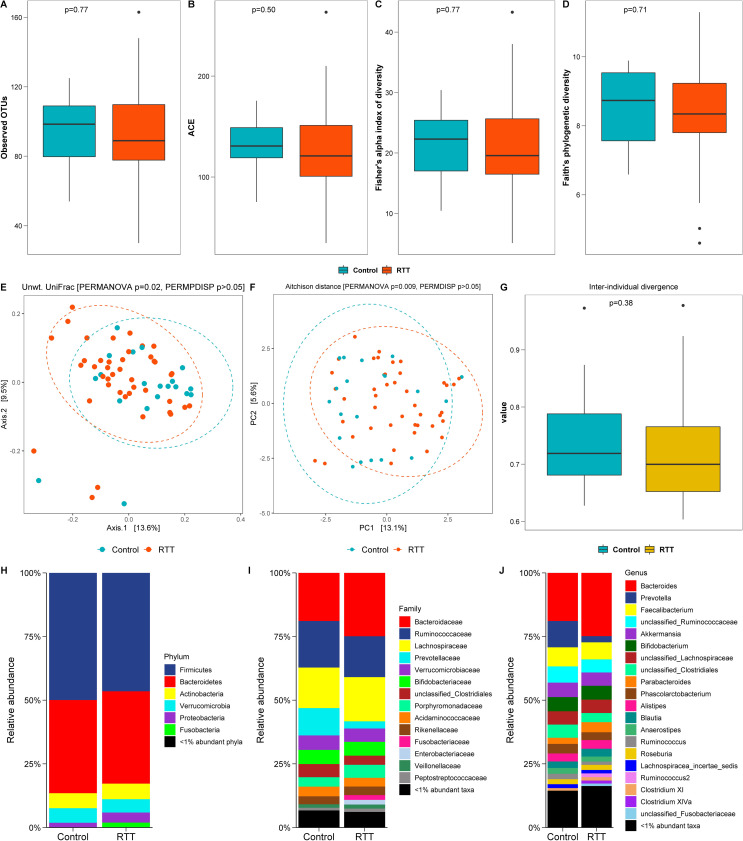
Fig 1. Gut bacterial microbiome in RTT patients and unaffected controls.
Number of observed OTUs (A), abundance based coverage estimate (ACE) values (B), Fisher’s alpha index of diversity (C) and Faith’s phylogenetic diversity (D) were slightly lower, but not statistically significant, in the RTT group than the control. Wilcoxon rank sum p <0.05 was considered statistically significant. Beta diversity ordinations using PCoA plot of the unweighted UniFrac distance (E) and PCA plot of the Aitchison distance (F) showed differences in bacterial composition between the RTT and control groups (PERMANOVA p<0.05). Axis labels represent the percentage variation explained by each axis. Unwt. = unweighted; PCo = principal coordinate; PC = principal component. The first two coordinates/components that explained the largest fraction of variably in our data was plotted. The inter-individual divergence value with respect to the median profile (G) within the control group was generally larger than the RTT group. Wilcoxon rank sum test p <0.05 was considered statistically significant. H-J shows relative abundance of bacterial taxa in the RTT and control groups at various taxonomic levels.

