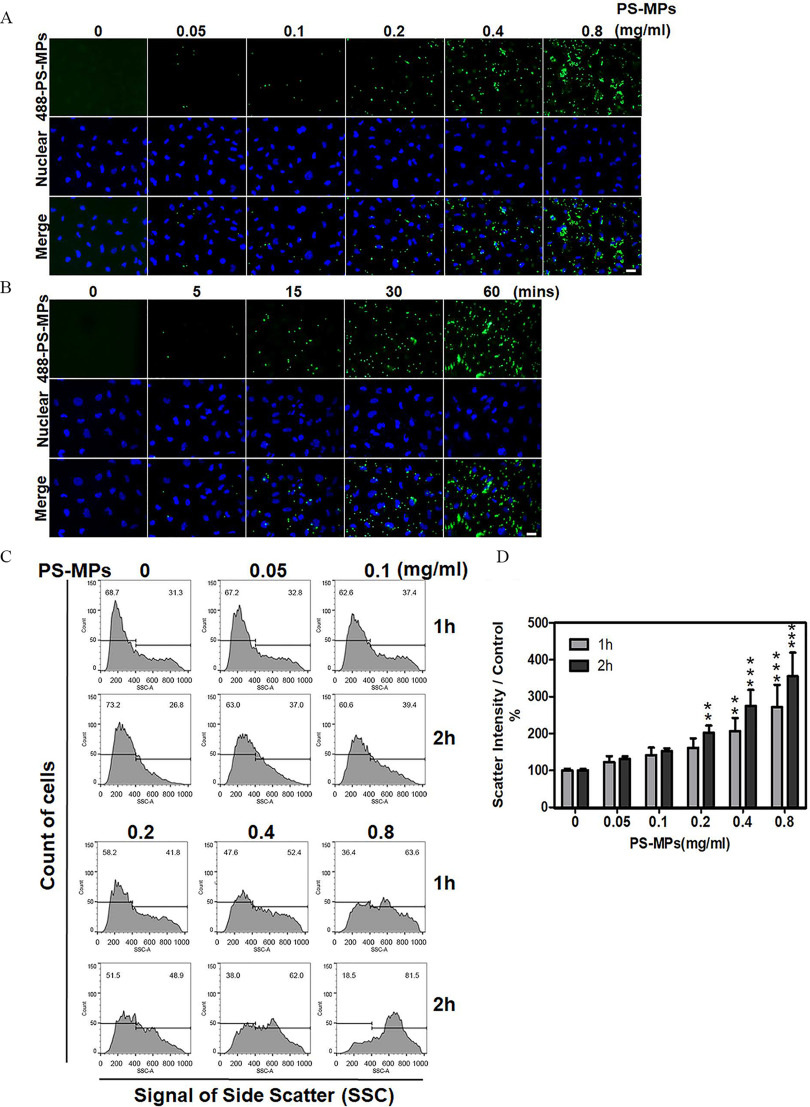
Figure 1.
Uptake of PS-MPs by HK-2 cells. (A) Cells were treated with PS-MPs (yellow-green fluorescence) at concentrations of 0.05, 0.1, 0.2, 0.4, and for 2 h. . (B) Cells were treated with PS-MPs (yellow-green fluorescence) for 0, 5, 15 30, and 60 min. DAPI (blue) was used for nuclear staining. . (C) Cells were treated with PS-MPs at concentrations of 0.05, 0.1, 0.2, 0.4, and for 1 and 2 h and analyzed by flow cytometry. (D) Scatter intensity signals were graphed and analyzed after treatment with PS-MPs at concentrations of 0.05, 0.1, 0.2, 0.4, and for 1 and 2 h. . ** and *** compared with the control group, as determined by two-way ANOVA with Sidak’s multiple comparisons test. Significance at 1 h: group vs. group: , group vs. group: ); 2 h: group vs. group: ; group vs. group: ; group vs. group: . The data are presented as the . The mean and SD summary data for quantification of (D) are shown in Table S3. -Values for all comparisons in (D) are reported in Table S4. Note: DAPI, 4,6-dimidyl-2-phenylindole; HK-2 cells, human kidney 2 cells; PS-MPs, polystyrene microplastics; SSC, side scatter light; SD, standard deviation.

