. 2021 May 6;129(5):057003. doi: 10.1289/EHP7612

Figure 2.

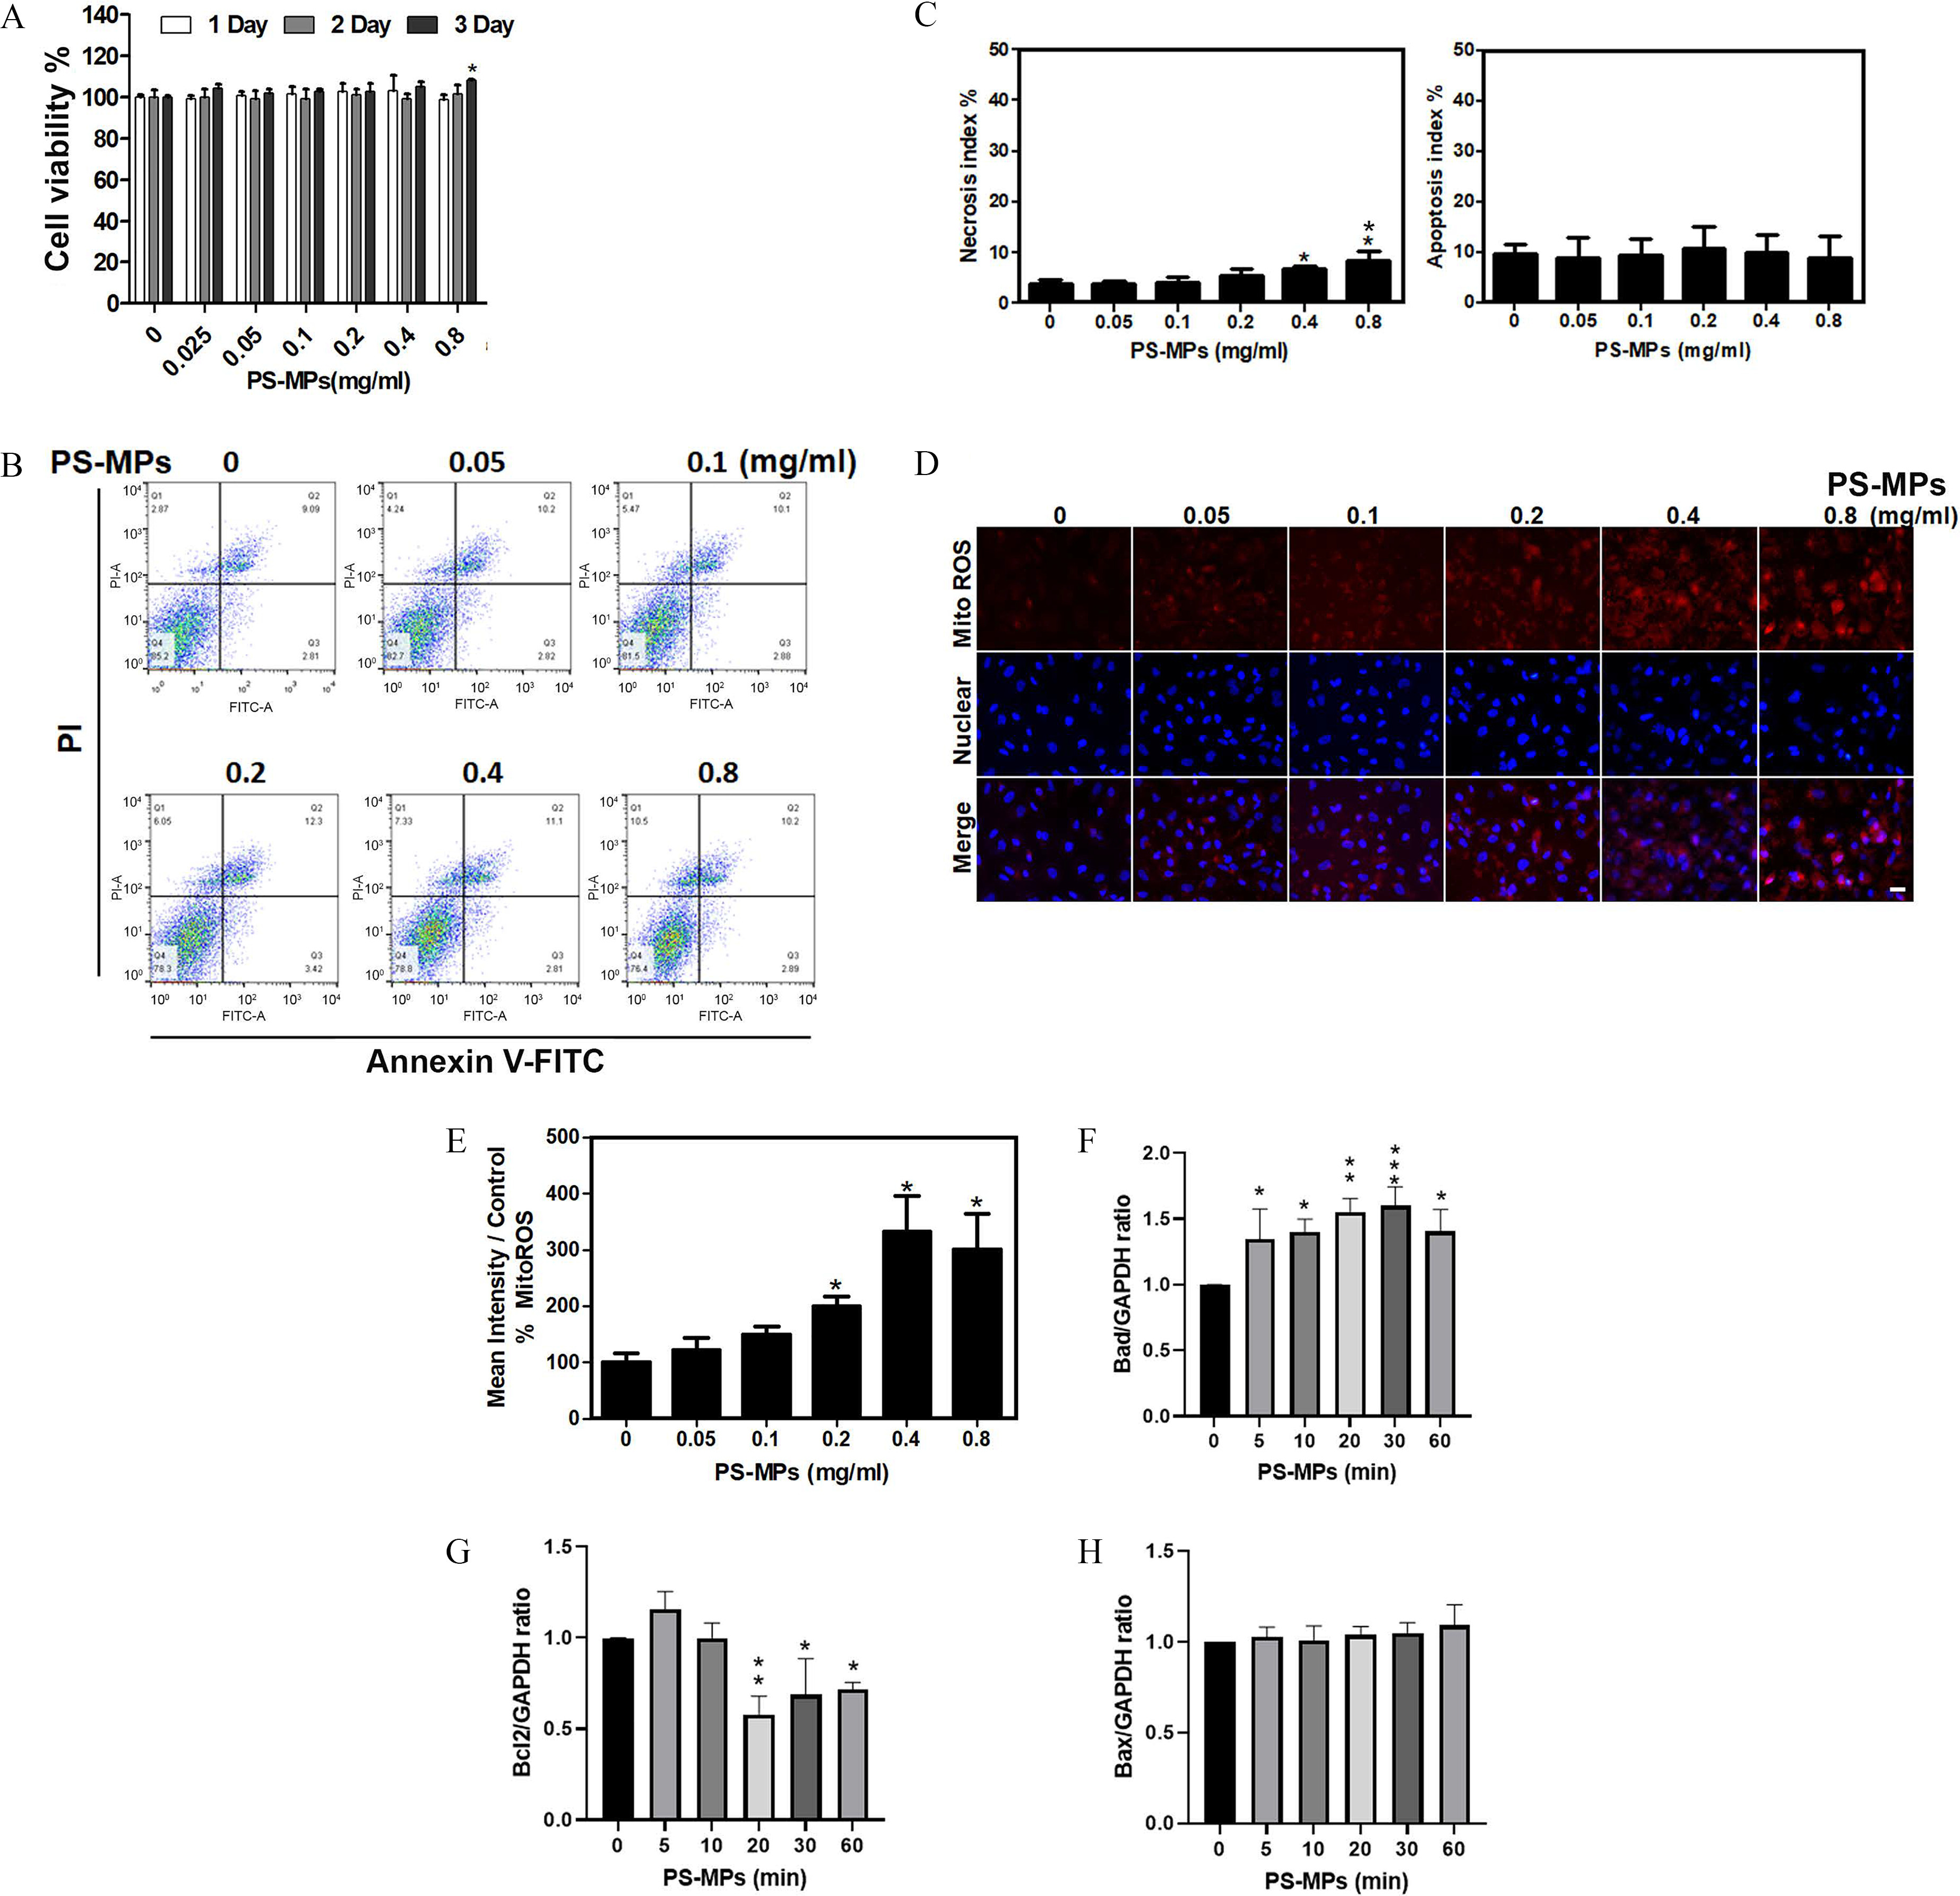
Figure 2A is a clustered bar graph plotting cell viability percentage, ranging from 0 to 140 in increments of 20 (y-axis) across polystyrene microplastics 0, 0.05, 0.1, 0.2, 0.4, and 0.8 milligrams per milliliter (x-axis) for 1 day, 2 days, and 3 days. Figure 2B is a set of six flow cytometry graphs plotting Propidium iodide for Propidium iodide-A, ranging from 10 begin superscript 0 end superscript to 10 begin superscript 4 end superscript in unit increments (y-axis) across Annexin V-fluorescein isothiocyanate for fluorescein isothiocyanate-A, ranging from 10 begin superscript 0 end superscript to 10 begin superscript 4 end superscript in unit increments (x-axis) for Polystyrene microplastics, concentrations of 0, 0.05, and 0.1 (milligram per milliliter) for the first three graphs and 0.2, 0.4, and 0.8 (milligram per milliliter) for the last three graphs, respectively. Figure 2C is a set of two bar graphs plotting Necrosis index percentage and Apoptosis index percentage, ranging from 0 to 50 in increments of 10 (y-axis) across Polystyrene microplastics (0, 0.05, 0.1, 0.2, 0.4, and 0.8 milligram per milliliter) (x-axis), respectively. Figure 2D is a display of six columns, titled Polystyrene microplastics, concentration of 0, 0.05, 0.1, 0.2, 0.4, and 0.8 (milligram per milliliter) and three rows, namely, Merge, Nuclear, and Mitochondrial Reactive Oxygen Species (rows). Figure 2E is a bar graph plotting mean intensity per control percentage Mitochondrial Reactive Oxygen Species, ranging from 0 to 500 in increments of 100 (y-axis) across Polystyrene microplastics (0, 0.05, 0.1, 0.2, 0.4, and 0.8 milligram per milliliter) (x-axis). Figures 2F to 2H are bar graphs plotting Bad per Glyceraldehyde-3-phosphate dehydrogenase, ranging from 0.0 to 2.0 in increments of 0.5; 0.0 to 1.5 in increments of 0.5; and 0.0 to 1.5 in increments of 0.5 (y-axis) across Polystyrene microplastics (minutes), ranging from 0 to 10 in increments of 5, 10 to 30 in increments of 10, and 30 to 60 in increments of 30 (x-axis), respectively.

Cell viability, apoptosis, necrosis, mitochondrial ROS levels, and apoptosis-related proteins expression in HK-2 cells treated with PS-MPs. (A) Cell viability was determined after treatment with PS-MPs at concentrations of 0.05, 0.1, 0.2, 0.4, and 0.8mg/mL for 1, 2, and 3 d. n=3. *p<0.05 compared with the control group, as determined by two-way ANOVA with Dunnett’s multiple comparisons test. Significance: Day 3, 0-mg/mL group vs. 0.8-mg/mL group: p=0.0241. The mean and SD summary data of (A) are shown in Table S3. For all p-values, see Table S4. (B) Apoptosis was detected by flow cytometry after treatment with PS-MPs at concentrations of 0.05, 0.1, 0.2, 0.4, and 0.8mg/mL for 24 h. (C) The necrosis and apoptosis indexes were graphed and analyzed. n=3. *p<0.05 and **p<0.01 compared with the control group, as determined by one-way ANOVA with Dunnett’s multiple comparison test. Significance: necrosis index: 0-mg/mL group vs. 0.4-mg/mL group: p=0.0319, 0-mg/mL group vs. 0.8-mg/mL group: p=0.0026; apoptosis index: no significant differences (Table S4). The mean and SD summary data of (C) are shown in Table S3. (D) Mitochondrial ROS were detected with 5μM MitoSOX Red after treatment with PS-MPs at concentrations of 0.05, 0.1, 0.2, 0.4, and 0.8mg/mL for 6 h. DAPI (blue) was used for nuclear staining. Scale bar: 20μm. (E) Mitochondrial ROS levels were graphed and statistically analyzed. n=2. *p<0.05 and ***p<0.001 compared with the control group, as determined by one-way ANOVA with Dunnett’s multiple comparison test. Significance: 0-mg/mL group vs. 0.2-mg/mL group: p=0.0331, 0-mg/mL group vs. 0.4-mg/mL group: p<0.001, 0-mg/mL group vs. 0.8-mg/mL group: p=0.001. The mean and SD summary data of (E) are shown in Tables S3 and S4. The levels of apoptosis-related proteins, such as (F) Bad, (G) Bcl2, and (H) Bax, were assessed after treatment with PS-MPs at a concentration of 0.8mg/mL for 0, 5, 10, 20, 30, and 60 min. GAPDH served as an internal control. The data are presented as the means±SDs. The mean and SD summary data for quantification of western blots are shown in Table S3. The western blotting results were quantified and statistically analyzed as shown in Figure 2. Note: ANOVA, analysis of variance; DAPI, 4,6-dimidyl-2-phenylindole; GAPDH, glyceraldehyde 3-phosphate dehydrogenase; HK-2 cells, human kidney 2 cells; PS-MPs, polystyrene microplastics; ROS, reactive oxygen species; SD, standard deviation.