. 2021 May 6;129(5):057003. doi: 10.1289/EHP7612

Figure 4.

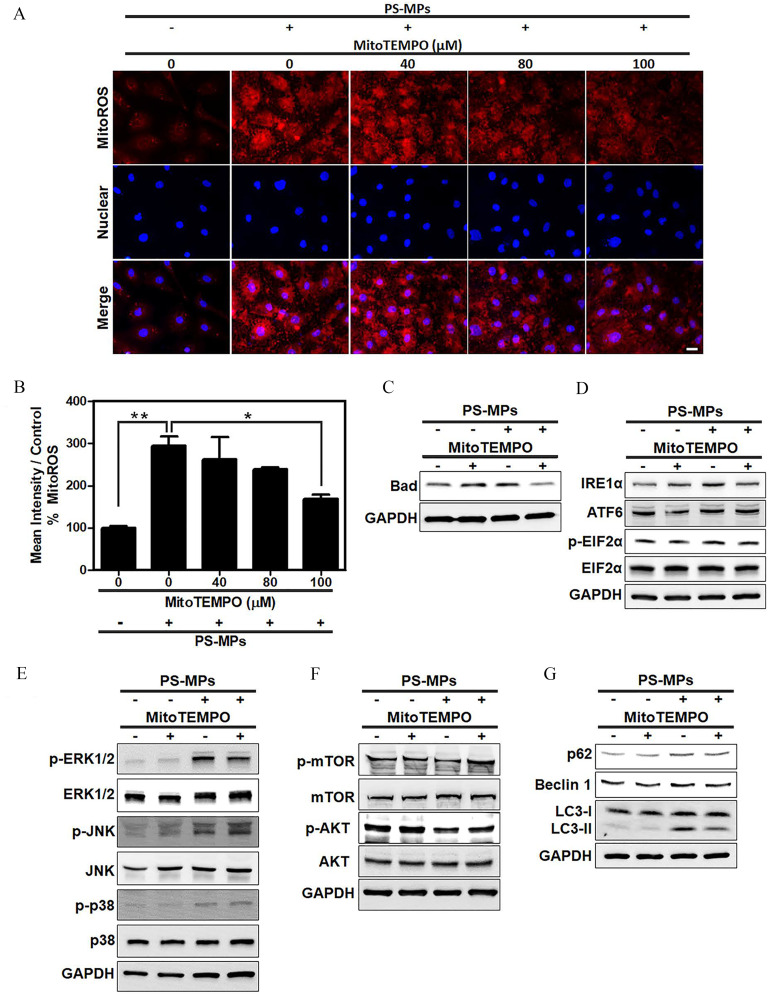
Figure 4A is a display of five columns titled mitochondria-Tempo (micromolar) and Polystyrene microplastics, concentrations of 0 (negative), 0 (positive), 40 (positive), 80 (positive), and 100 (positive) and three rows, namely, Merge, Nuclear, mitochondria reactive oxygen species. Figure 4B is a bar graph plotting mean intensity per control percentage mitochondria reactive oxygen species, ranging from 0 to 400 in increments of 100 (y-axis) across mitochondria-Tempo (micromolar) and Polystyrene microplastics, ranging as 0 (negative), 0 (positive), 40 (positive), 80 (positive), and 100 (positive; x-axis). Figure 4C is a western blot plotting mitochondria-Tempo, depicting negative, positive, negative, and positive and Polystyrene microplastics, depicting negative, negative, positive, and positive (columns), respectively, across Bad and Glyceraldehyde-3-phosphate dehydrogenase (rows). Figure 4D is a western blot plotting mitochondria-Tempo, depicting negative, positive, negative, and positive and Polystyrene microplastics, depicting negative, negative, positive, and positive (columns), respectively, across inositol-requiring transmembrane kinase or endoribonuclease 1 lowercase alpha, Activating transcription factor 6, phosphorylation of eukaryotic initiation factor-2 lowercase alpha, eukaryotic initiation factor-2 lowercase alpha, and glyceraldehyde-3-phosphate dehydrogenase (rows). Figure 4E is a western blot plotting mitochondria-Tempo, depicting negative, positive, negative, and positive and Polystyrene microplastics, depicting negative, negative, positive, and positive (columns), respectively, across Phosphorylated-Extracellular signal-regulated kinases 1 and 2, Extracellular signal-regulated kinases 1 and 2, Phosphorylated-c-Jun N-terminal kinase, c-Jun N-terminal kinase, Phosphorylated-p 38 mitogen-activated protein kinases, p 38 mitogen-activated protein kinases, and glyceraldehyde-3-phosphate dehydrogenase (rows). Figure 4F is a western blot plotting mitochondria-Tempo, depicting negative, positive, negative, and positive and Polystyrene microplastics, depicting negative, negative, positive, and positive (columns), respectively, across Phosphorylated-mammalian target of rapamycin, mammalian target of rapamycin, Phosphorylated-Protein kinase B, Protein kinase B, and glyceraldehyde-3-phosphate dehydrogenase (rows). Figure 4G is a western blot plotting mitochondria-Tempo, depicting negative, positive, negative, and positive and Polystyrene microplastics, depicting negative, negative, positive, and positive (columns), respectively, across Sequestosome 1, Beclin-1, light chain 3-1, light chain 3-2, and glyceraldehyde-3-phosphate dehydrogenase (rows).

Levels of Bad, ER stress-related proteins, MAPK-, and AKT/mTOR signaling pathway proteins and autophagy-related proteins after PS-MP treatment in HK-2 cells with mitochondrial ROS inhibition. (A) Mitochondrial ROS levels (red) using MitoSOX Red stain after pretreatment with MitoTEMPO at concentrations of 40, 80, and 100μM. After MitoTEMPO pretreatment, PS-MPs were added at a concentration of 0.8mg/mL. DAPI (blue) was used for nuclear staining. Scale bar: 20μm. (B) The mean intensity after inhibition of mitochondrial ROS production was normalized to that in the control group and graphed. n=3. *p<0.05 and **p<0.01 compared with the control group, as determined by one-way ANOVA with Dunnett’s multiple comparison test. Significance: 0.8-mg/mL PS-MPs group vs. 0 PS-MPs mg/mL group: p=0.0019, 0.8-mg/mL PS-MP–only group vs. 0.8-mg/mL PS-MPs+100μM MitoTEMPO group: p=0.0135. The mean and SD summary data of (B) are shown in Table S3. See Table S4 for p-values for all comparisons. (C) The expression of apoptosis-related protein Bad was examined. Cells were pretreated with MitoTEMPO (100μM) for 1 h, PS-MPs (0.8mg/mL) were added, and the cells were incubated for another 20 min. (D) The expression of ER stress-related proteins, such as IRE1α, ATF6, p-EIF2α, and EIF2α, was examined. Cells were pretreated with MitoTEMPO for 1 h, PS-MPs were added, and the cells were incubated for another 24 h. (E) The phosphorylation of MAPK signaling pathway components p38, ERK1/2, and JNK was examined. Cells were pretreated with MitoTEMPO for 12 h, PS-MPs were added, and the cells were incubated for another 30 min. (F) The phosphorylation of AKT/mTOR pathway components mTOR, and AKT was examined. Cells were pretreated with MitoTEMPO for 1 h, PS-MPs were added, and the cells were incubated for another 1 h. (G) The expression of autophagy-related proteins p62, Beclin 1, and LC3 was examined after pretreatment with MitoTEMPO for 1 h and treatment with 0.8mg/mL PS-MPs for 24 h. GAPDH served as an internal control. The data are presented as the means±SDs. The mean and SD summary data for quantification of western blots are shown in Table S3. The western blotting results were quantified and statistically analyzed, as shown in Figure S8. Note: AKT, protein kinase B; ANOVA, analysis of variance; ATF6, activating transcription factor 6; DAPI, 4,6-dimidyl-2-phenylindole; EIF2α, eukaryotic initiation factor 2 alpha; ER, endoplasmic reticulum; ERK1/2, extracellular signal-regulated kinases 1 and 2; GAPDH, glyceraldehyde 3-phosphate dehydrogenase; HK-2 cells, human kidney 2 cells; IRE1α, inositol-requiring enzyme 1α; JNK, c-Jun N-terminal kinase; MAPK, mitogen-activated protein kinase; mTOR, mitogen-activated protein kinase; p, phosphorylated; PS-MPs, polystyrene microplastics; ROS, reactive oxygen species; SD, standard deviation.