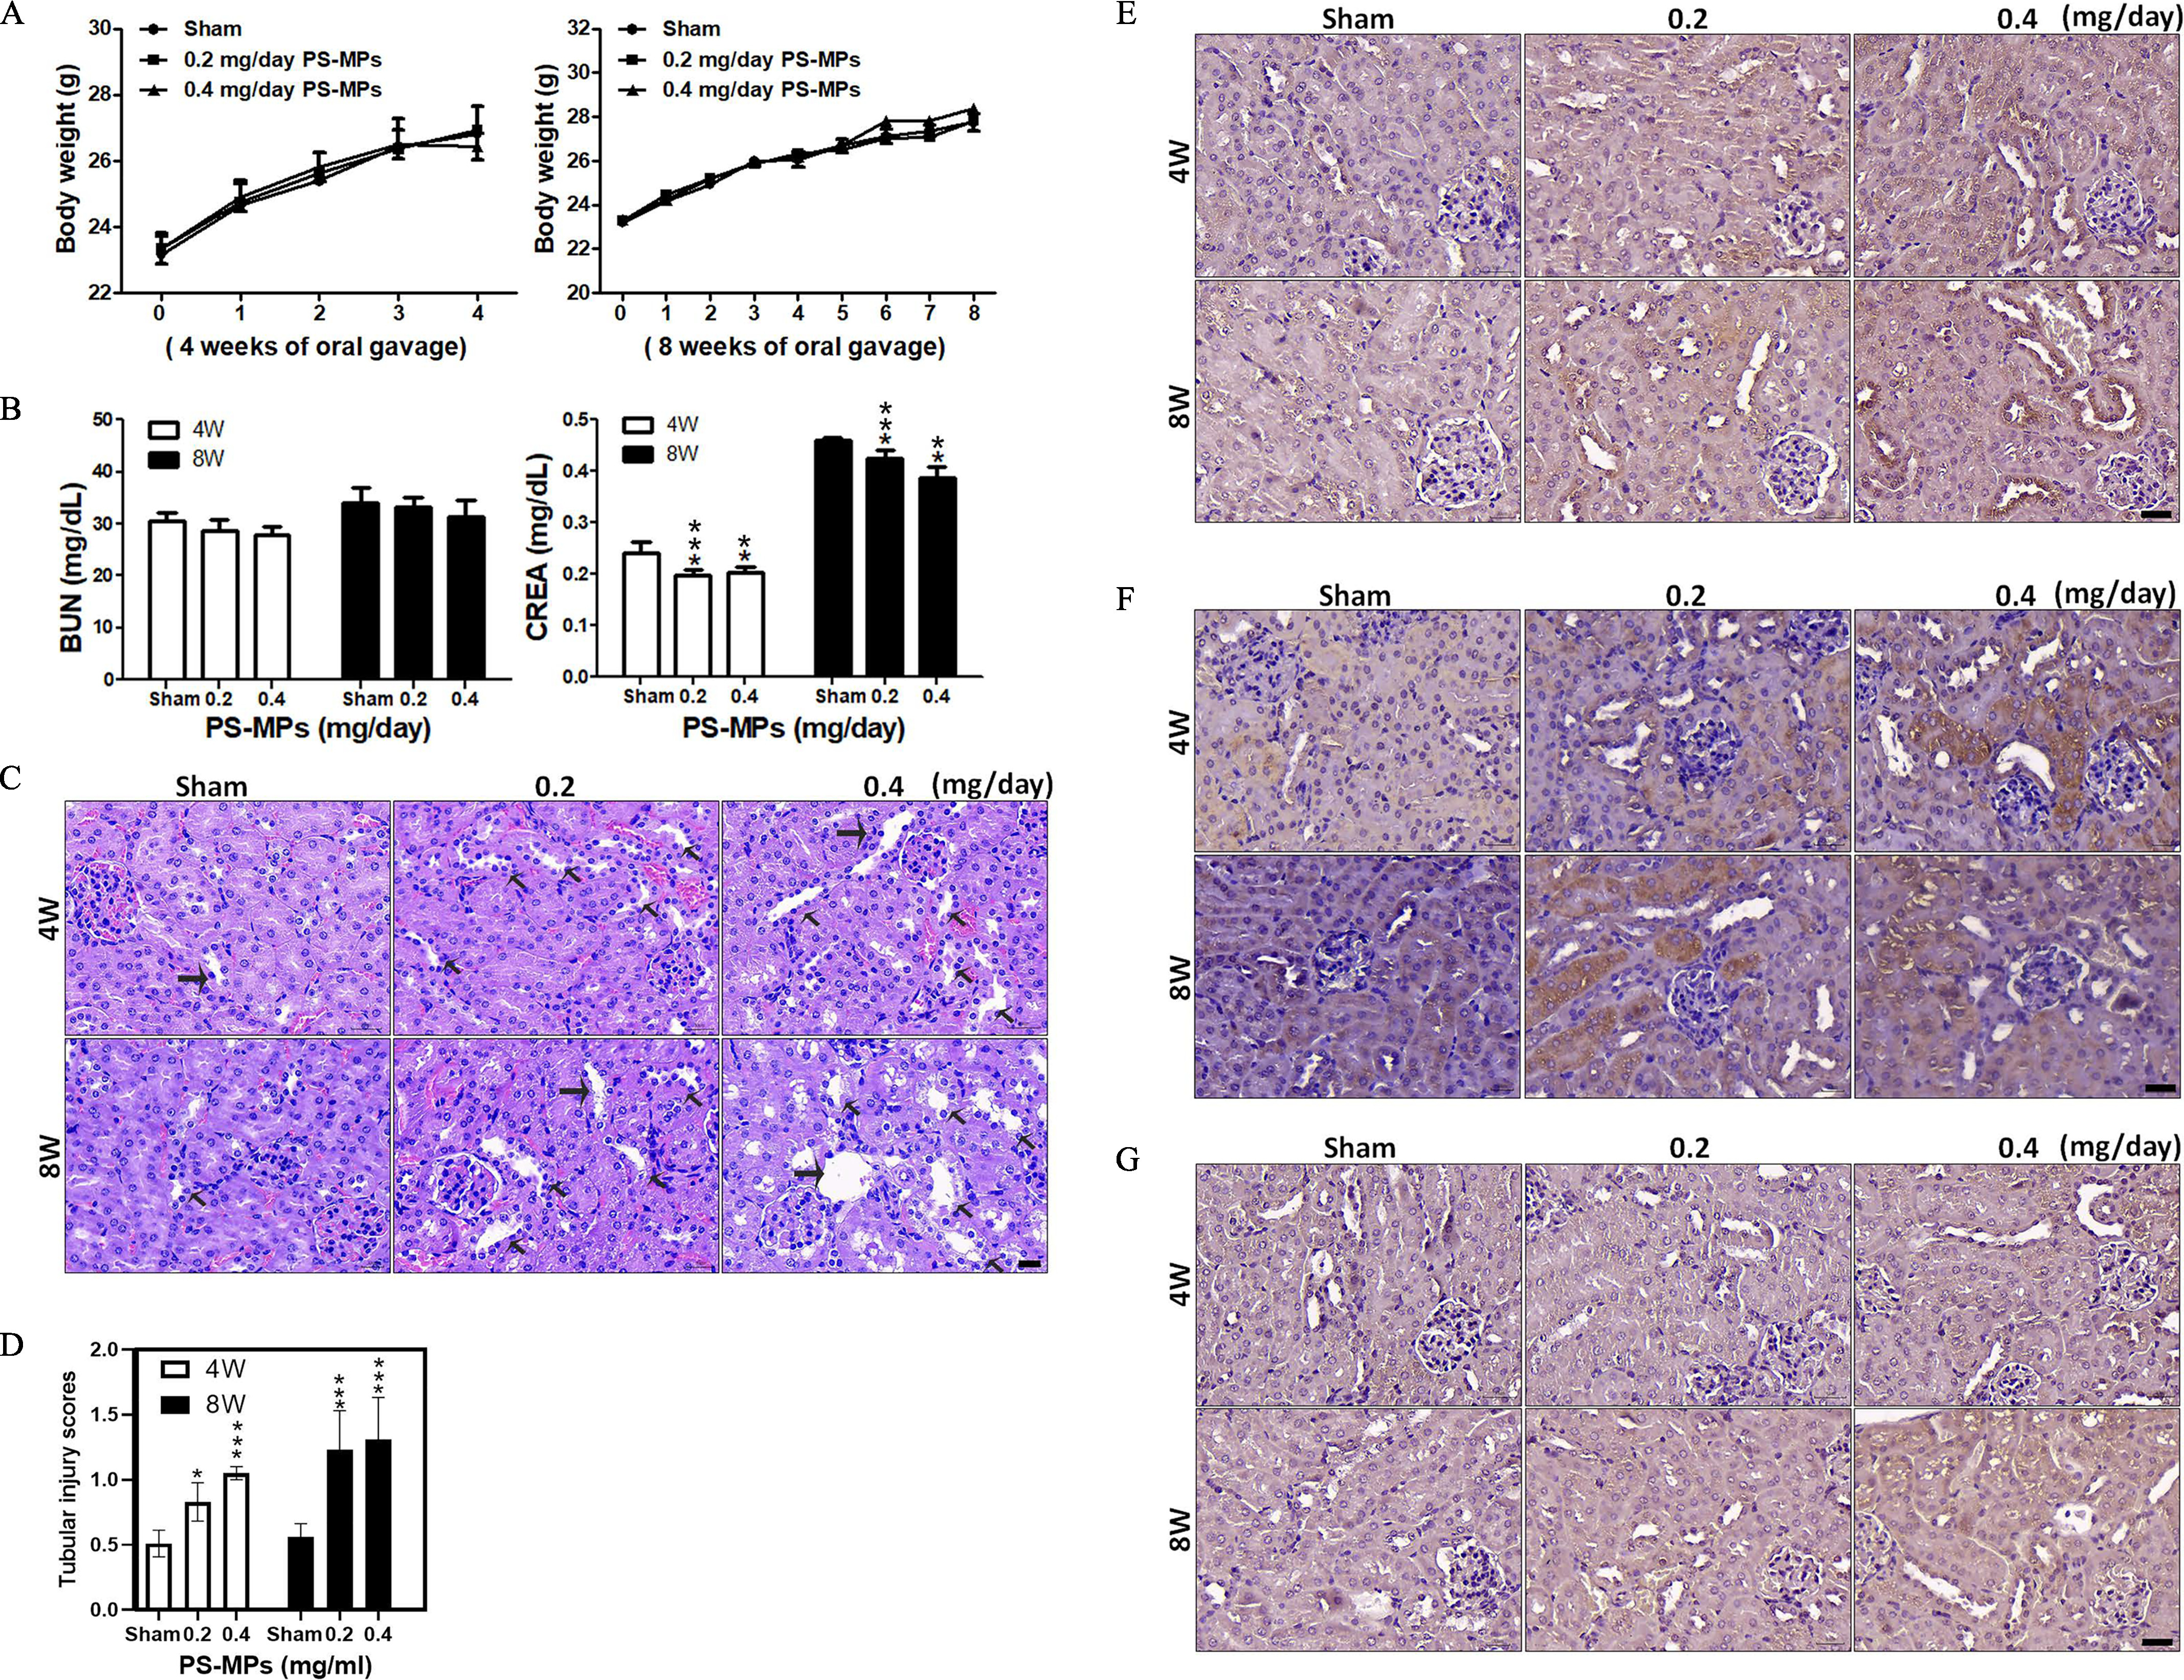
Figure 6.

Body weights, blood biochemistry index values, H&E staining in kidney sections, tubulointerstitial injury, and IHC for ER stress-, inflammation-, and autophagy-related proteins in kidney sections for mice treated with PS-MPs. (A) The body weights of mice were measured after PS-MPs were administered with concentrations of 0.2 and for 4 and 8 wk. The data are presented as the , . The mean and SD summary data of (A) are shown in Table S3. (B) Blood biochemistry was analyzed via assessment of BUN and creatinine. The data are presented as the . . ** and *** compared with sham group, as determined by two-way ANOVA with Tukey’s multiple comparisons test. Significance: BUN: no significant differences (Table S3); creatinine: 4 wk: sham group vs. group: , sham group vs. group: ; 8 wk: sham group vs. group: , sham group vs. group: , group vs. group: . The mean and SD summary data of (B) are shown in Table S3. All -values shown in Table S3. (C) H&E staining of representative kidney sections. Hematoxylin stained the cell nuclei blue, and eosin stained the extracellular matrix and cytoplasm pink. . The arrows indicate lesions. (D) Tubulointerstitial injury analyses in kidneys. The data are presented as the . Twenty fields of view per kidney (5 mice per group). * and *** compared with sham group samples, as determined by two-way ANOVA with Dunnett’s multiple comparisons test. Significance: 4 wk: sham group vs. group: , sham group vs. group: ; and 8 wk; sham group vs. group: , sham group vs. group: . The mean and SD summary data of (D) are shown in Table S3. All -values reported in Table S4. (E) IHC of expressed in the kidney sections. . (F) IHC of COX-1 expressed in the kidney sections. . (G) IHC of LC3 expressed in the kidney sections. . . The quantified IHC data were graphed and statistically analyzed, as shown in Table S5. Note: ANOVA, analysis of variance; BUN, blood urea nitrogen; COX-1, cyclooxygenase-1; CREA, creatinine; ER, endoplasmic reticulum; H&E, hematoxylin and eosin; , inositol-requiring enzyme ; IHC, immunohistochemistry; PS-MPs, polystyrene microplastics; SD, standard deviation.
