. 2021 May 6;129(5):057003. doi: 10.1289/EHP7612

Figure 7.

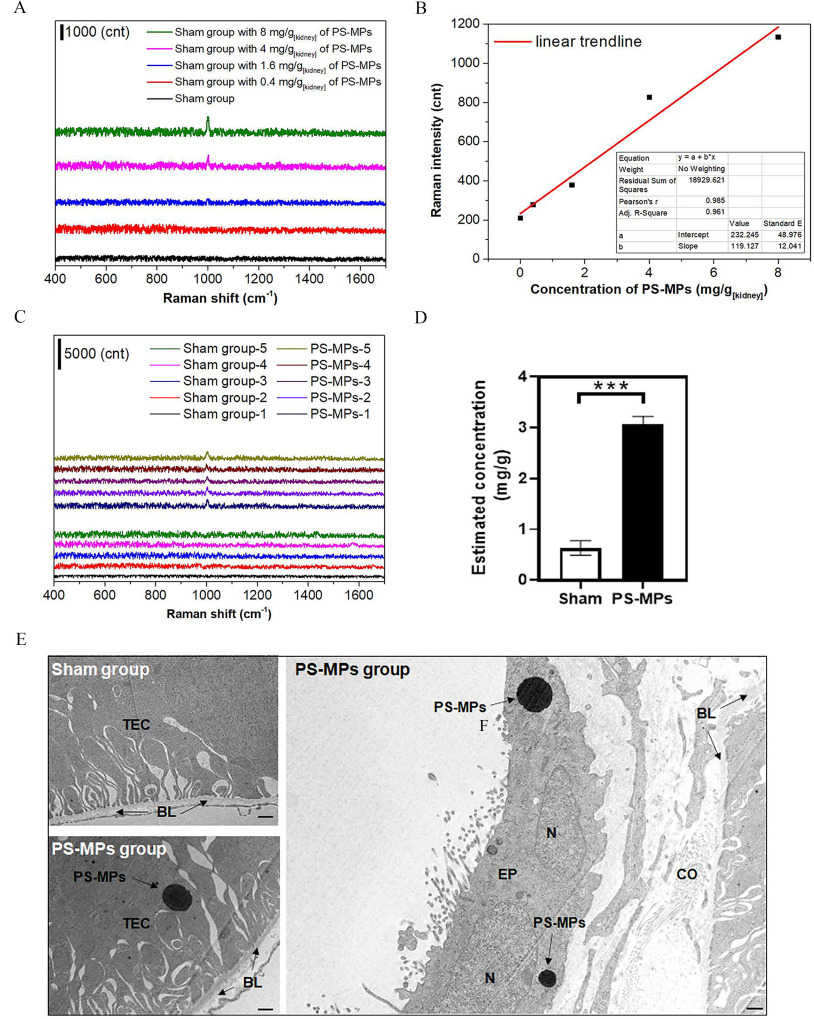
Figure 7A is a Raman spectroscopy plotting 1,000 (count) (y-axis) across Raman shift (centimeter begin superscript negative end superscript), ranging from 400 to 1,600 in increments of 200 (x-axis) for sham group with 8 milligrams per gram kidney of Polystyrene microplastics, sham group with 4 milligrams per gram kidney of Polystyrene microplastics, sham group with 1.6 milligrams per gram kidney of Polystyrene microplastics, sham group with 0.4 milligrams per gram kidney of Polystyrene microplastics, and sham group. Figure 7B is line graph plotting Raman intensity (count), ranging from 0 to 1,200 in increments of 200 (y-axis) across concentration of Polystyrene microplastics (milligram per gram kidney), ranging from 0 to 8 in increments of 2 (x-axis) for linear trendline. Figure 7C is a Raman spectroscopy plotting 5,000 (count) (y-axis) across Raman shift (centimeter begin superscript negative end superscript), ranging from 400 to 1,600 in increments of 200 (x-axis) for Sham group 5 and Polystyrene microplastics 5; Sham group 4 and Polystyrene microplastics 4; Sham group 3 and Polystyrene microplastics 3; Sham group 2 and Polystyrene microplastics 2; and Sham group 1 and Polystyrene microplastics 1. Figure 7D is a bar graph plotting estimated concentration (milligram per gram), ranging from 0 to 4 in unit increments (y-axis) across sham and Polystyrene microplastics (x-axis). Figure 7E is a transmission electron microscopy analysis of the kidney tissues in mice. The sham group and Polystyrene microplastics treatment group (0.4 milligram per day Polystyrene microplastics for 8 weeks) including basal lamina, nucleus, tubular epithelial cell, epithelial cell, and collagen fibril were observed.

Raman analysis and TEM of kidney tissue from mice treated with PS-MPs. (A) Raman signals for ground kidney samples containing PS-MPs at 0, 0.4, 1.6, 4, and 8mg/gkidney. (B) Raman signal for ring breathing mode. (C) There were no Raman peaks at 1,000cm1 for the ground kidney samples of the sham-treated mice (sham group 1–5), in contrast to the samples from the mice treated with 0.4mg/d PS-MPs for 8 wk (PS-MPs group 1–5) (Table S2). (D) Statistical results of Raman analysis for each mouse. The estimated concentrations of PS-MPs in each kidney are shown in Table S2. The mean and SD summary data of (D) are shown in Table S3. n=5. ***p<0.001 compared with the sham group, as determined by t-test. Significance: sham group vs. PS-MPs group: p<0.001. (E) TEM analysis of the kidney tissues (n=3). The sham group and PS-MPs treatment group (0.4mg/d PS-MPs for 8 wk) were observed. Scale bar: 500 nm. Note: BL, basal lamina; cnt, count; CO, collagen fibril; EP, epithelial cell; N, nucleus; PS-MPs, polystyrene microplastics; TEC, tubular epithelial cell; SD, standard deviation; TEM, transmission electron microscopy.