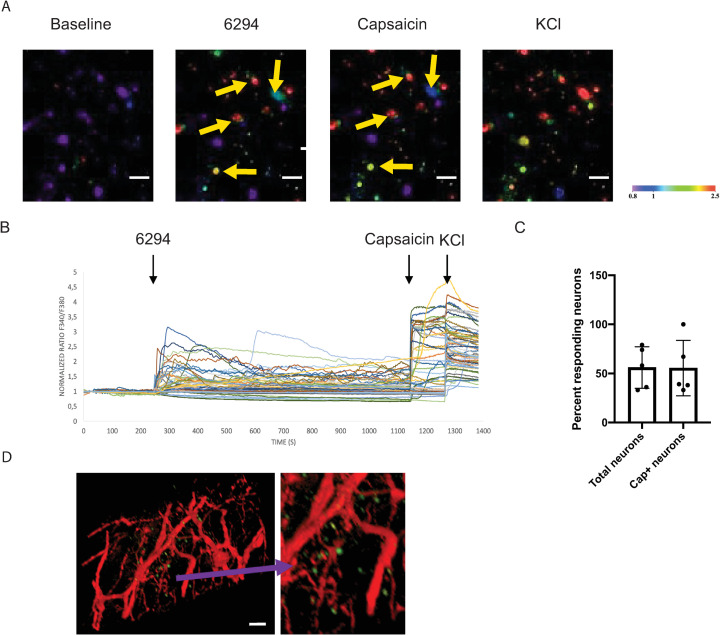
Fig 2. P. aeruginosa 6294 activates trigeminal neurons.
Trigeminal ganglia were harvested from C57BL67/N mice; cultured neuronal cells (see text) were exposed to live P. aeruginosa 6294 (MOI 10), capsaicin, and potassium chloride (KCl). Calcium influx into the neuronal cells was imaged in real-time using Fura-2 AM dye. Capsaicin activated TRPV1 firing; KCl activated all neurons. A. Representative confocal images of neuronal cells responding to stimuli acquired at 40x magnification; scale bar, 50μm. Neurons were imaged for 30 minutes. The appearance of green or red neuronal cells (arrows) indicates increase of intracellular Ca2+ levels proportionally to the degree of activation in real-time (color bar: fluorescence intensity, arb. units). B. Representative time course of calcium traces in activated neurons in one of two independent experiments. Time course is followed measuring normalized fluorescence intensity 340/360 ratio. Black arrows indicate the time point of application of 6294, capsaicin, and KCl. C. Bar graph depicts the total number of responding neurons per field of view at 10x magnification. The first bar indicates percent of neurons responding to bacteria; values are mean +/-SD. The second bar depicts the number of neurons responding to P. aeruginosa that also respond to capsaicin stimulation. Cumulatively, data show that similar numbers of TG neurons respond to capsaicin and P. aeruginosa. D. Representative whole-mount ocular image shows the proximity of bacteria and neuronal fibers. Mice expressing a red fluorescent protein under the NaV 1.8 promoter (Nav 1.8cre/TdTomato, red) were infected with 5x10⁵ CFU/eye GFP-expressing P. aeruginosa 6294 (Green). The scale bar is 20μm. Cumulatively, these data demonstrate that P. aeruginosa induces Ca2+ influxes in neurons, reflective of activation.

