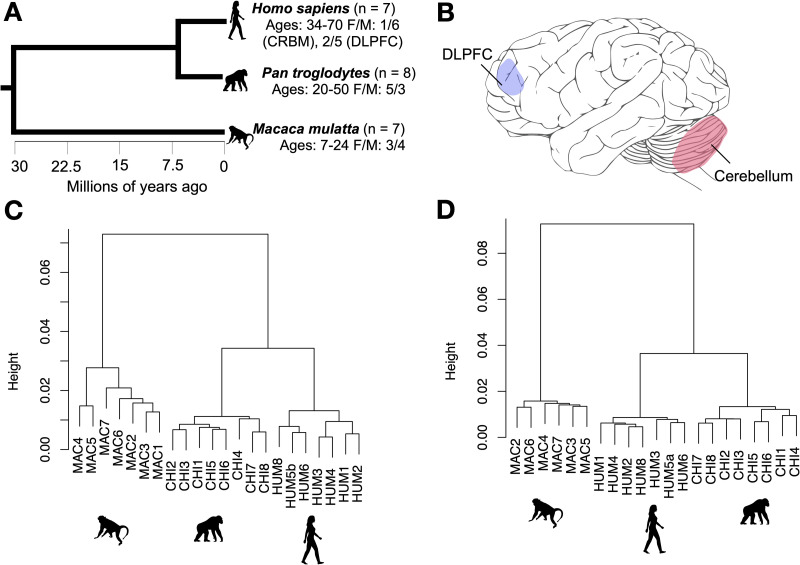
Fig 1. Species relationships, brain structures, and sample clustering.
A = Phylogenetic tree of species included in this study from TimeTree.org [113], B = brain structures included in this study depicted on a chimpanzee brain illustration modified from [114], C and D = hierarchical clustering of samples from the dorsolateral prefrontal cortex (C) and cerebellum (D) based on genome-wide methylation after filtering and normalizing using correlations between samples as distance. DLPFC = dorsolateral prefrontal cortex.

