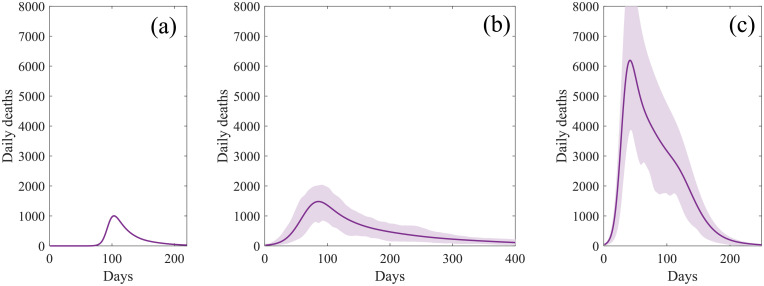
Fig 4. Simulated daily deaths without vaccination.
(a) First wave of infection as observed from the start of 2020. (b) Subsequent wave of infection following relaxation to limited NPIs, sufficient to reduce the basic reproductive number to approximately R = 1.8(±0.1). (c) Subsequent infection wave following complete relaxation of all NPIs leading to R = 2.3(±0.2). Uncertainty is represented by the shaded region, within which 95% of simulations are found to fall.

