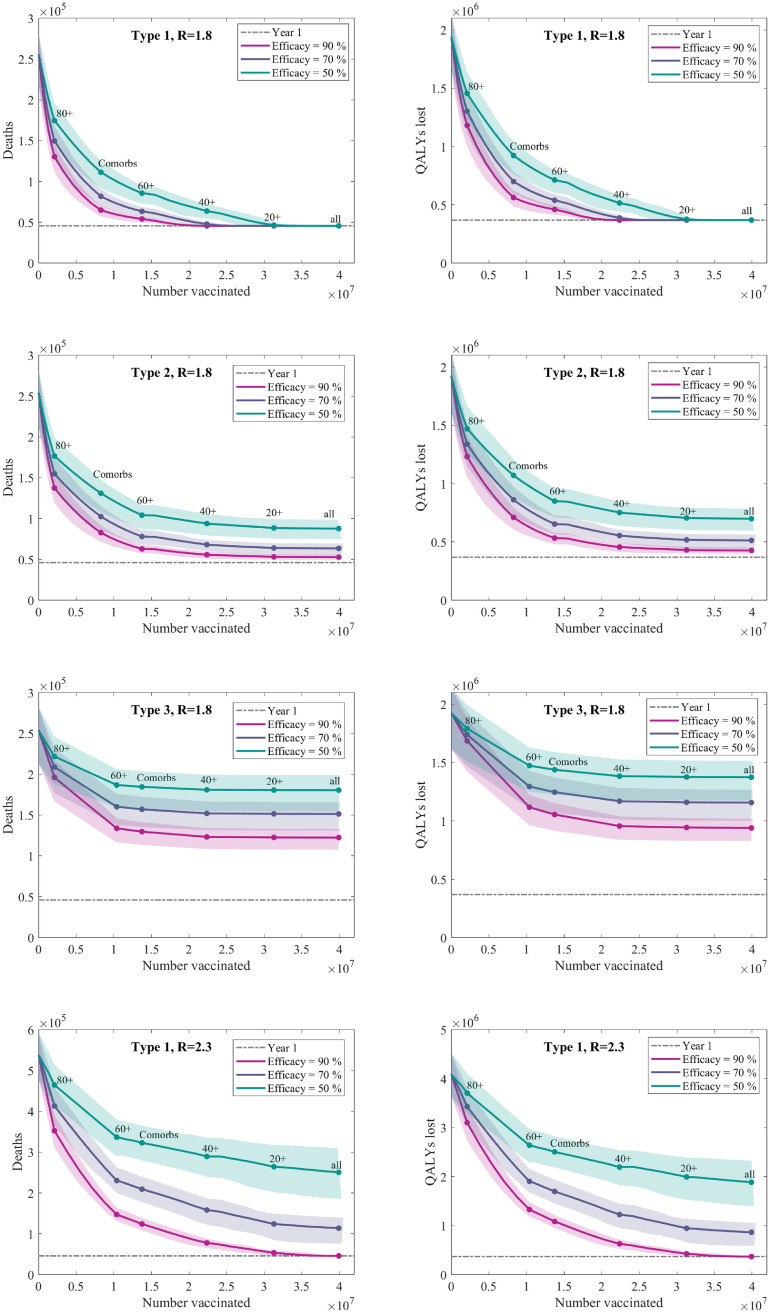
Fig 7. Deaths and QALYs lost versus the proportion of the population vaccinated.
We use the optimal vaccination ordering with a maximum vaccine uptake of 70% across the population. The optimal vaccination ordering did not depend on the collection of considered vaccine efficacies. We display the mean values of 100 independent simulations for each vaccine efficacy (solid lines), with 95% prediction intervals (shaded regions). The grey dotted line shows the base level of mortality from the first wave of the pandemic.

