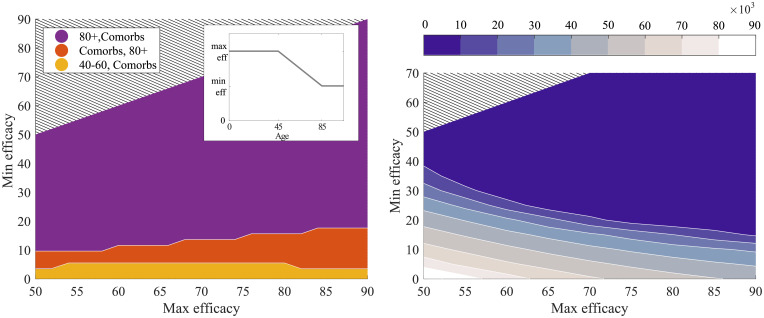
Fig 9. The effect of different levels of declining type 1 vaccine efficacy (R ≈ 1.8) on both the optimal vaccine ordering and success at limiting mortality.
A maximum efficacy value is applied to all individuals below the age of 45 and a minimum level to individuals above the age of 85. Efficacy is assumed to decay linearly between these two levels to give the efficacy for intermediary age groups. This distribution is represented by the inset in left panel. The left panel shows when, dependent on minimum and maximum efficacy, the two groups deemed most significant for vaccination impact vary. In the purple region it is optimal to vaccinate those above the age of 80 followed by comorbidities, in the red comorbidities followed by 80+ and in the yellow those in the 40-60 age group followed by comorbidities. The right panel shows the expected further mortality following vaccination with 70% of the whole population vaccinated for different minimum/maximum type 1 vaccine efficacies. The large dark blue region corresponds to less than 10,000 deaths following vaccination.

