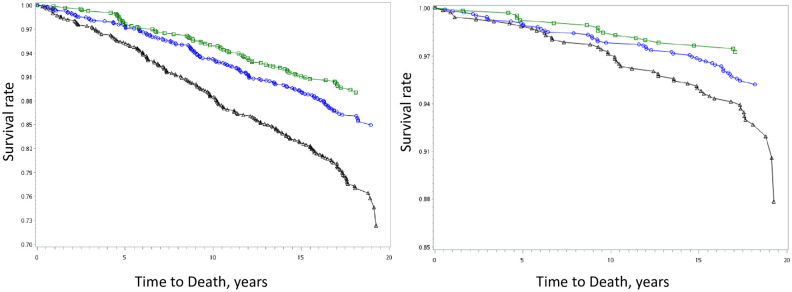
Fig 1. Survival Curves of The Healthy Taiwanese Eating Approach for (a) total and (b) cardiovascular mortality.
A significant difference existed among three groups in total and cardiovascular mortality (both p-value less than 0.05). Taiwanese Eating Approach were classified into three groups, group 1 (black triangle, poor diet), group 2 (blue circle, average diet), and group 3 (green square, healthy diet).

