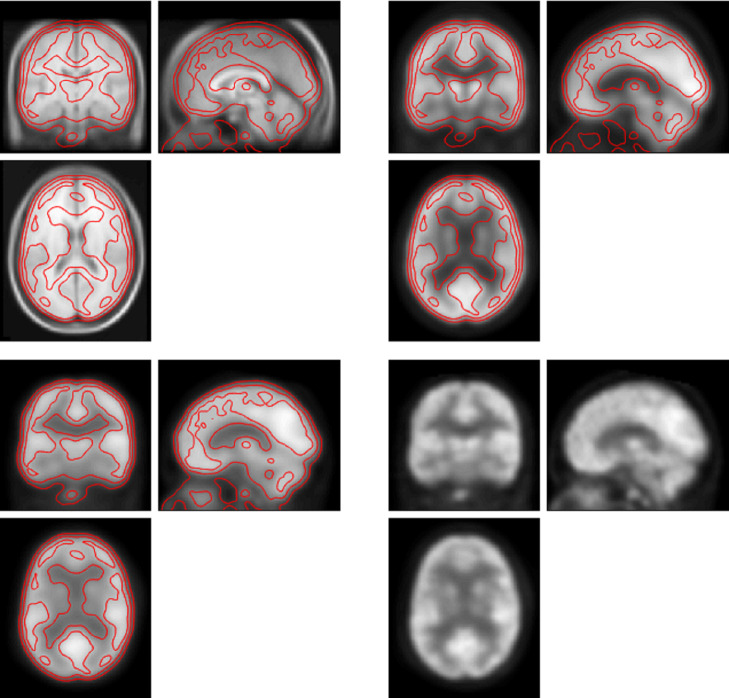
Fig 1. Example of FDG PET imaging post-processing.
Left upper panel: MRI brain template (T1) with coronal, sagittal, and axial views, generated from 305 normal subjects. Right upper panel: FDG PET brain template of summed 100 normal subjects. Left lower panel:Smoothed FDG PET brain of one study subject. Right lower panel: Normalized FDG PET brain of the same subject. The red line is the contour of the subject’s normalized brain imaging.

