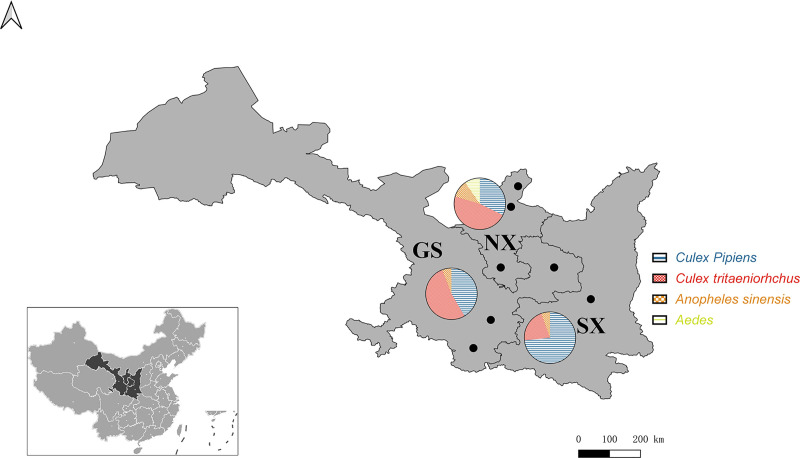
Fig 1. Map of mosquito collection sites.
The Shanxi-Gansu-Ningxia region is labeled in light gray and cities where the collection sites were located are indicated with black dots. The pie charts on the map show the composition of mosquito species collected in each province, with each color representing a mosquito species. The location of the Shaanxi-Gansu-Ningxia region is shown in dark gray on the map of China in the lower left of corner (GS: Gansu Province, SX: Shaanxi Province, NX: Ningxia Hui Autonomous Region). The base layer of this modified map originated from National Earth System Science Data Center, National Science & Technology Infrastructure of China (http://www.geodata.cn).

