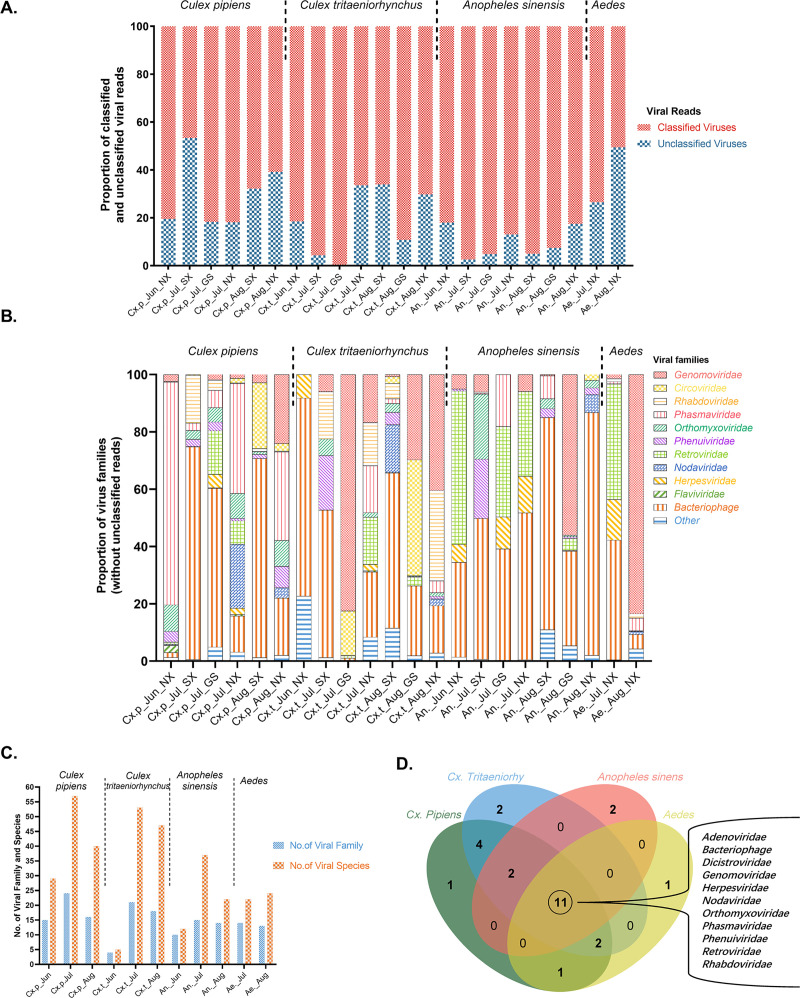
Fig 2. Virome of mosquitoes in the Shaanxi-Gansu-Ningxia region.
A. Proportions of classified and unclassified viral reads. Each bar represents a mosquito pool, as described in Table 1. B. Proportions of viral families among the classified viral reads. Each bar represents a mosquito pool, as described in Table 1. Read percentages lower than 0.1% are grouped as Others. C. Number of viral families and species among mosquitoes sorted by mosquito species and collection month. D. Venn diagram showing viral families found in the four mosquito groups. The four mosquito groups are presented in separate areas of the diagram. The numbers are representative of viral families found in mosquitos of each genus.

