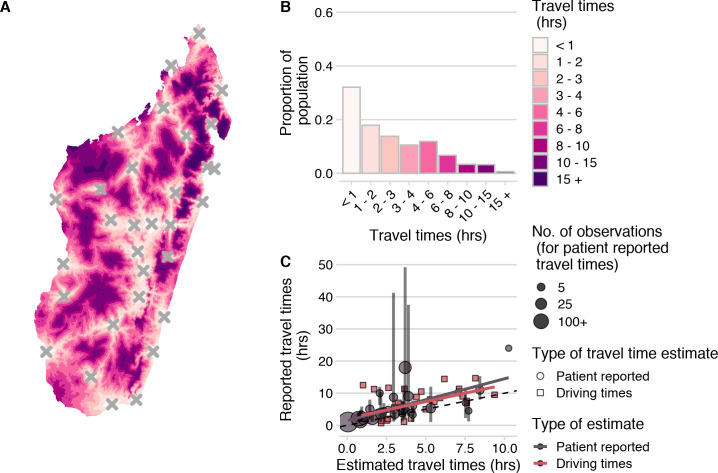
Fig 2. Travel times to clinics provisioning PEP across Madagascar.
(A)) Estimated at an ~ 1 km2 scale using the estimated from the Malaria Atlas Project friction surface (https://malariaatlas.org/research-project/accessibility-to-cities/, CC-BY 3.0) and on human population from WorldPop (https://www.worldpop.org/geodata/summary?id=70, CC-BY 4.0). (A)) Estimated at an ~ 1 km2 scale using the estimated from the Malaria Atlas Project friction surface (https://malariaatlas.org/research-project/accessibility-to-cities/, CC-BY 3.0) and on human population from WorldPop (https://www.worldpop.org/geodata/summary?id=70, CC-BY 4.0). (B) Distribution of the population across travel times. (C) Correlation between ground-truthed travel times (mean of patient reported travel times to the Moramanga PEP clinic at the commune level and reported driving times between GPS points) and friction surface travel time estimates. The vertical lines show the 95% quantiles for reported travel times and the point size shows the number of observations for each commune. The best fit lines (red and grey) from a linear model where observed travel times are predicted by estimated travel times for each data source are also shown. The dashed black line is the 1:1 line.

