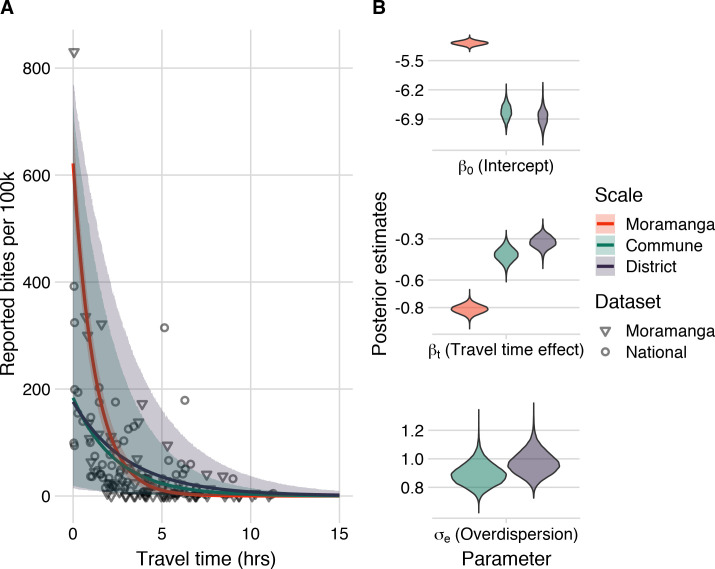
Fig 4. Travel times as a predictor of reported bite incidence per 100,000 persons.
(A) The estimated relationship between travel time in hours (x-axis) and mean annual reported bite incidence (y-axis). The lines are the mean estimates and the envelopes are the 95% prediction intervals generated by drawing 1000 independent samples from the parameter posterior distributions for three candidate models: model with travel times at the 1) commune- and 2) district-level fitted to the national data with an overdispersion parameter (σe) and 3) travel times at the commune level fitted to the Moramanga data with a fixed intercept and unadjusted for overdispersion. The points show the data: National data (circles) at the district level used to fit the District and Commune models, and Moramanga data (triangles) at the commune level used to fit the Moramanga model. (B) The posterior distribution of parameters from the respective models for the model intercept, travel time effect, and for overdispersion (national data only).

