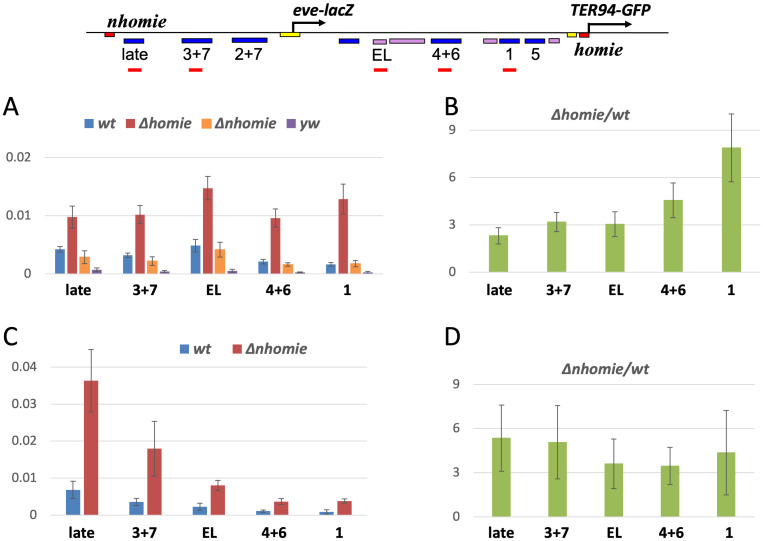
Fig 2. Non-coding RNA expression is increased by eve insulator removal.
Top map: locations of amplification products quantified by qPCR are shown as red bars. (A, B) transgenes in the H5 orientation (see Fig 1A and 1B). (A) RT-qPCR quantification of total RNA (normalized to RP49 RNA) from the indicated enhancer regions, in the wt, Δhomie, and Δnhomie transgenic lines (shown in Fig 1B), and in a yw control (no transgene: signal comes only from endogenous eve). Averages with standard deviations of 3 biological samples are graphed. Note that transcript levels are increased throughout the locus in Δhomie, but not in Δnhomie. (B) The ratios of average signals from Δhomie and wt in A are graphed (with standard deviations). (C, D) transgenes in the N5 orientation (see Fig 1A and 1C). (C) Similar to A, except that wt and Δnhomie are at the insertion site shown in Fig 1C. (D) The ratios of average signals (with standard deviations) from Δnhomie and wt in C are graphed.

