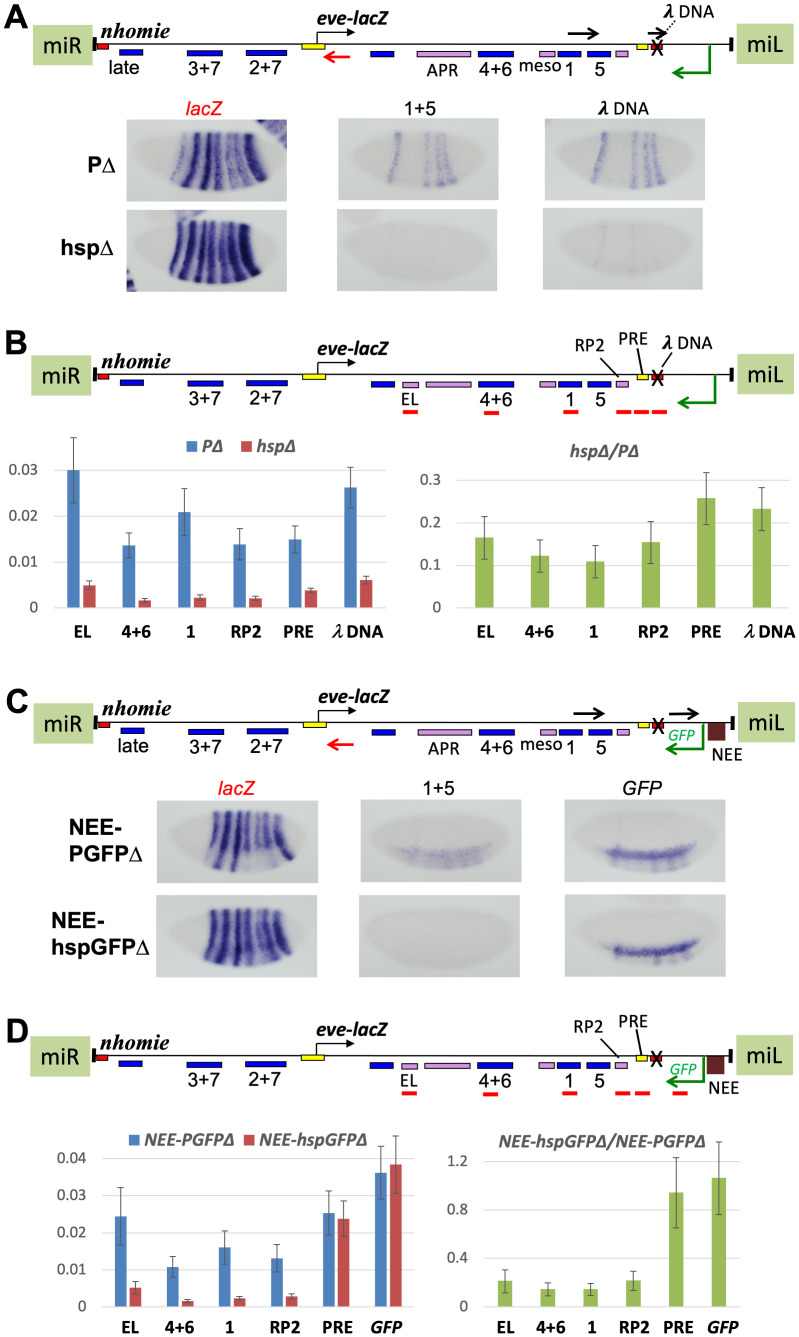
Fig 7. Processivity of read-through transcription from flanking promoters correlates with degree of repression of the eve promoter.
Transgenes are at the same MiMIC site, and in the same orientation, as in Fig 4. All loci have homie replaced with phage λ DNA (refer to map above each one). (A) eve-lacZ and flanking promoter-driven RNA expression in stage 5 embryos. Positions and orientations of the RNA probes used are shown as black and red arrows in the map. Images are labeled (above) with black lettering corresponding to black arrows, or red lettering corresponding to red arrows. Top row: transgene with P-element promoter (PΔ, also used in Fig 4B). Bottom row: transgene with hsp70 core promoter (hspΔ). Note that neither promoter has either the NEE or a GFP coding region. (B) Quantification of total RNA (normalized to RP49 RNA) from the indicated enhancer regions (probed regions are shown as red bars in the map) in the PΔ and hspΔ lines. Averages with standard deviations of 4 biological samples each from hspΔ and PΔ are graphed on the left, and the ratios of average signals (with standard deviations) are graphed on the right. (C) Same as in A, except that the both promoters have the NEE and a GFP coding region (but no polyA signal). (D) Same as in B, except that the promoters are as described in C.

