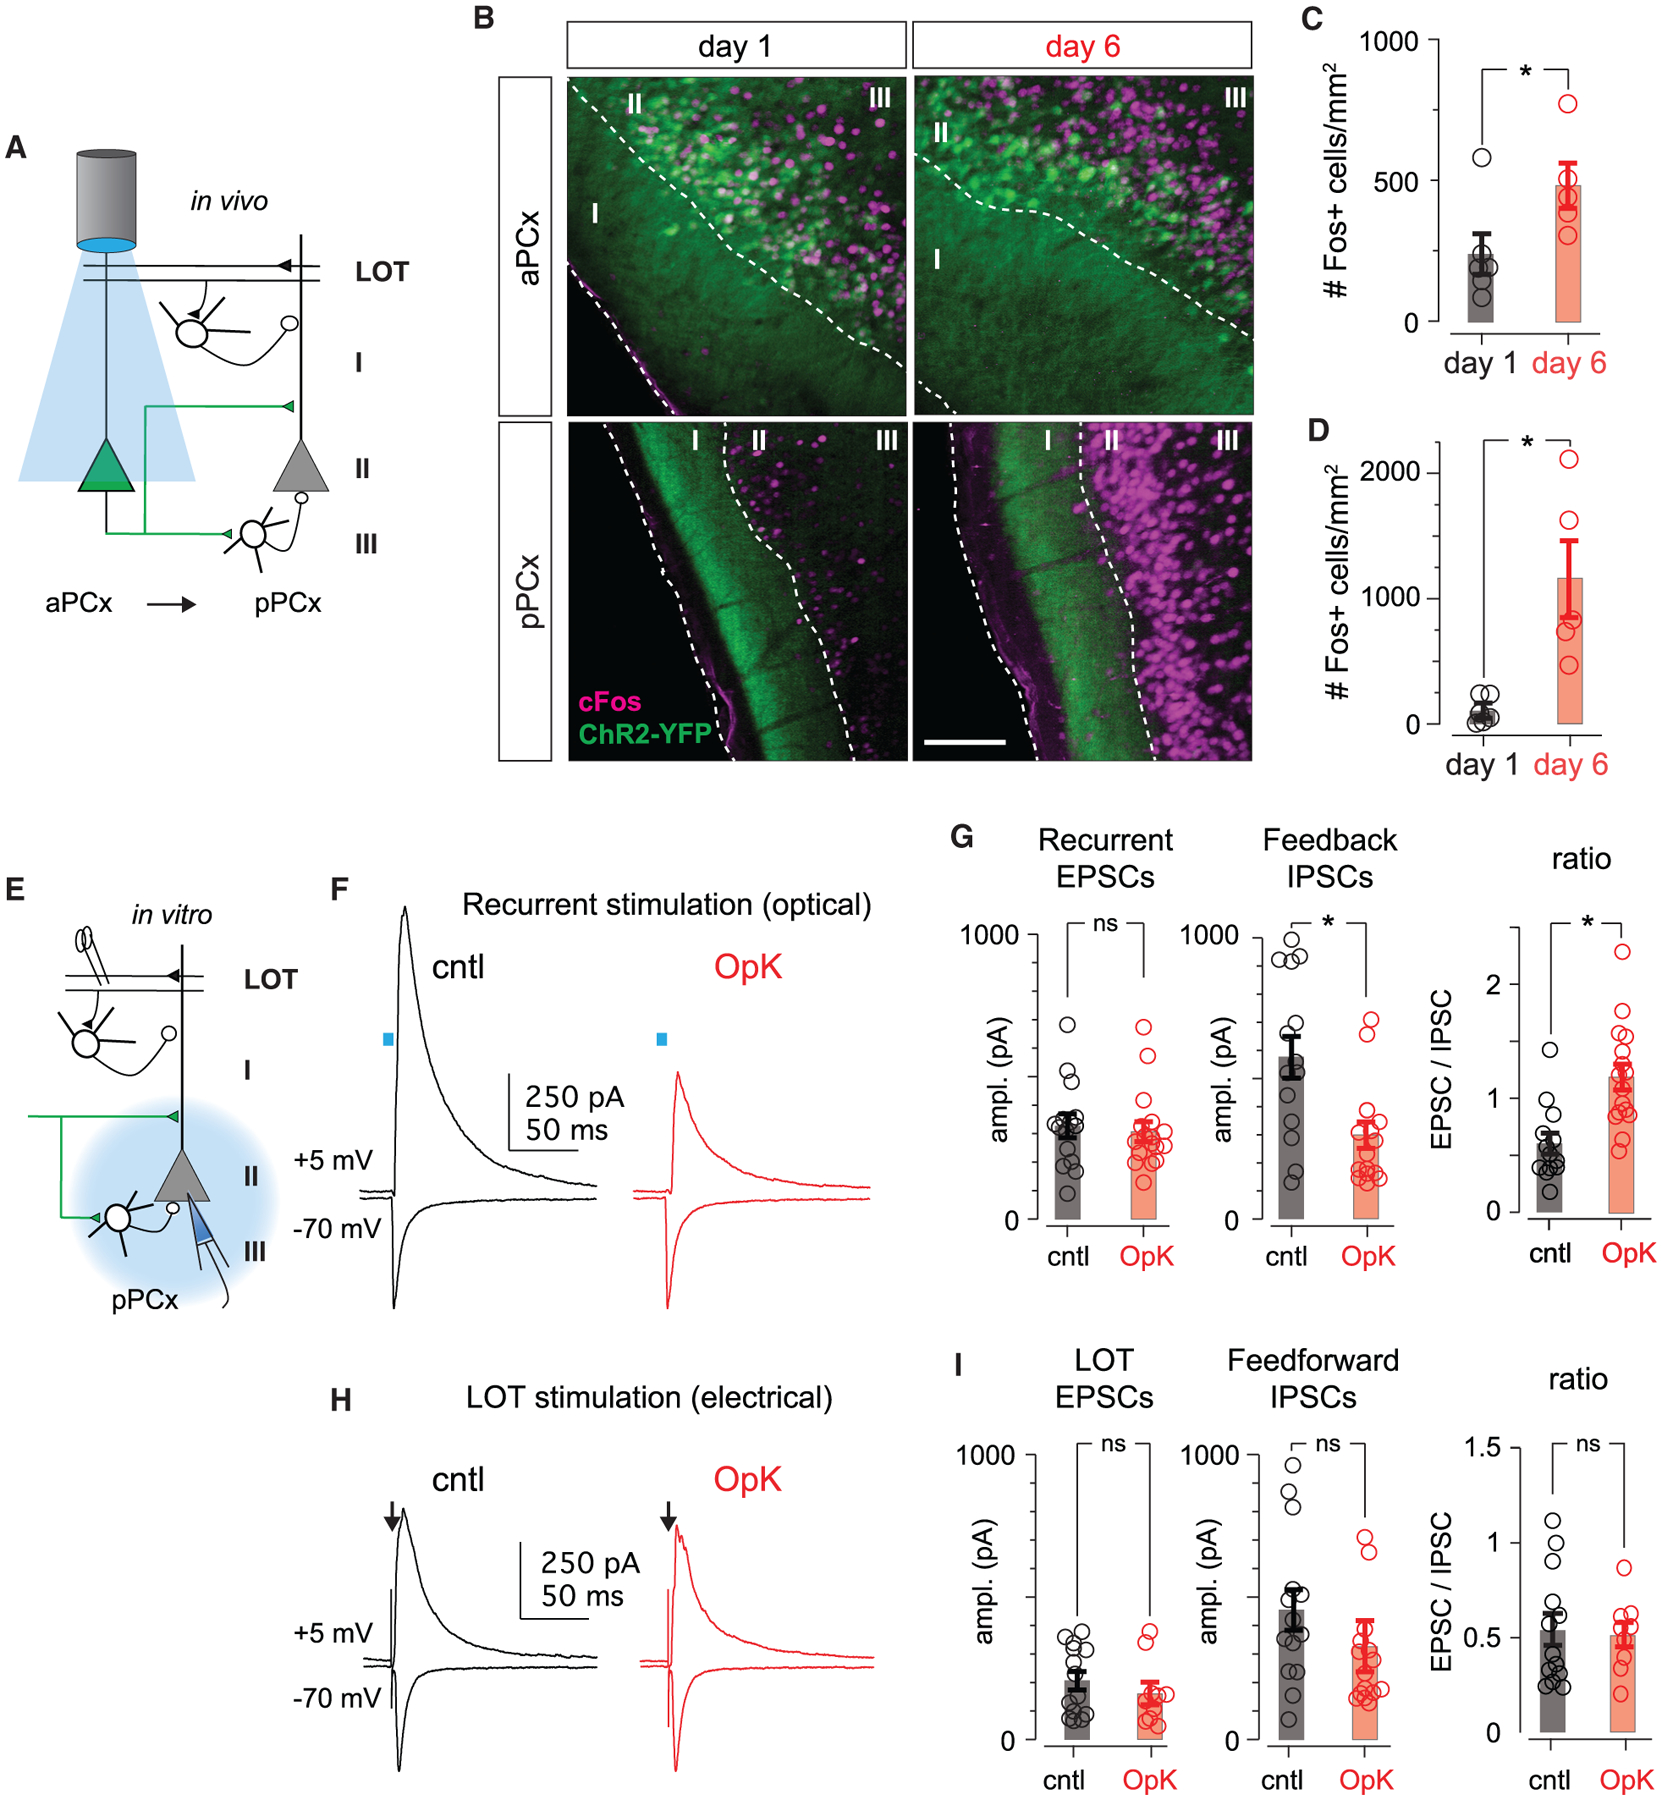
Figure 2. Optokindling disrupts the balance of recurrent excitation and feedback inhibition.

(A) Schematic showing in vivo stimulation paradigm. ChR2+ cells in aPCx are activated optically. ChR2− cells in pPCx receive excitatory recurrent inputs from aPCx but are not directly activated.
(B) ChR2-YFP and Fos expression in aPCx and pPCx from mice killed 1 h after the last stimulus on either day 1 or 6. Dashed white lines demarcate layers, which are labeled by numerals. ChR2-YFP+ cells in aPCx extend axons through layer I of pPCx. Scale bar: 100 μm.
(C) Number of Fos+ neurons in aPCx after the first or sixth day of stimulation. Bars indicate mean Fos+ cell counts across animals, and error bars represent SEM; each circle represents the mean number of Fos+ neurons per mouse averaged across four sequential 50-μm sections.
(D) As in (C) but for pPCx.
(E) Schematic of in vitro slice experiments. We recorded from ChR2− pyramidal cells and either measured monosynaptic recurrent EPSCs and disynaptic feedback IPSCs evoked by optically activating ChR2+ axons. We also activated excitatory olfactory bulb inputs and disynaptic feedforward inhibition by electrically stimulating mitral cell axons in the LOT.
(F) Recurrent EPSCs (Vm = −70 mV) and feedback IPSCs (Vm = +5 mV) in an example cell from an unstimulated control (cntl) mouse (black traces) and in a cell from an OpK mouse (red traces) evoked by 2-ms light pulses (blue bars).
(G) Amplitudes of recurrent EPSCs (left), disynaptic feedback IPSCs (middle), and their ratios (right) evoked using equivalent stimuli in cells from cntl and OpK mice. Each circle represents the amplitude or amplitude ratio for a single cell, bars indicate average across cells, and error bars represent SEM.
(H) Example afferent EPSCs and feedforward IPSCs evoked by electrically stimulating the LOT (arrows). Stimulus artifacts have been truncated for clarity.
(I) Summary of evoked EPSC amplitudes, IPSC amplitudes, and their ratios following electrical LOT stimulation.
