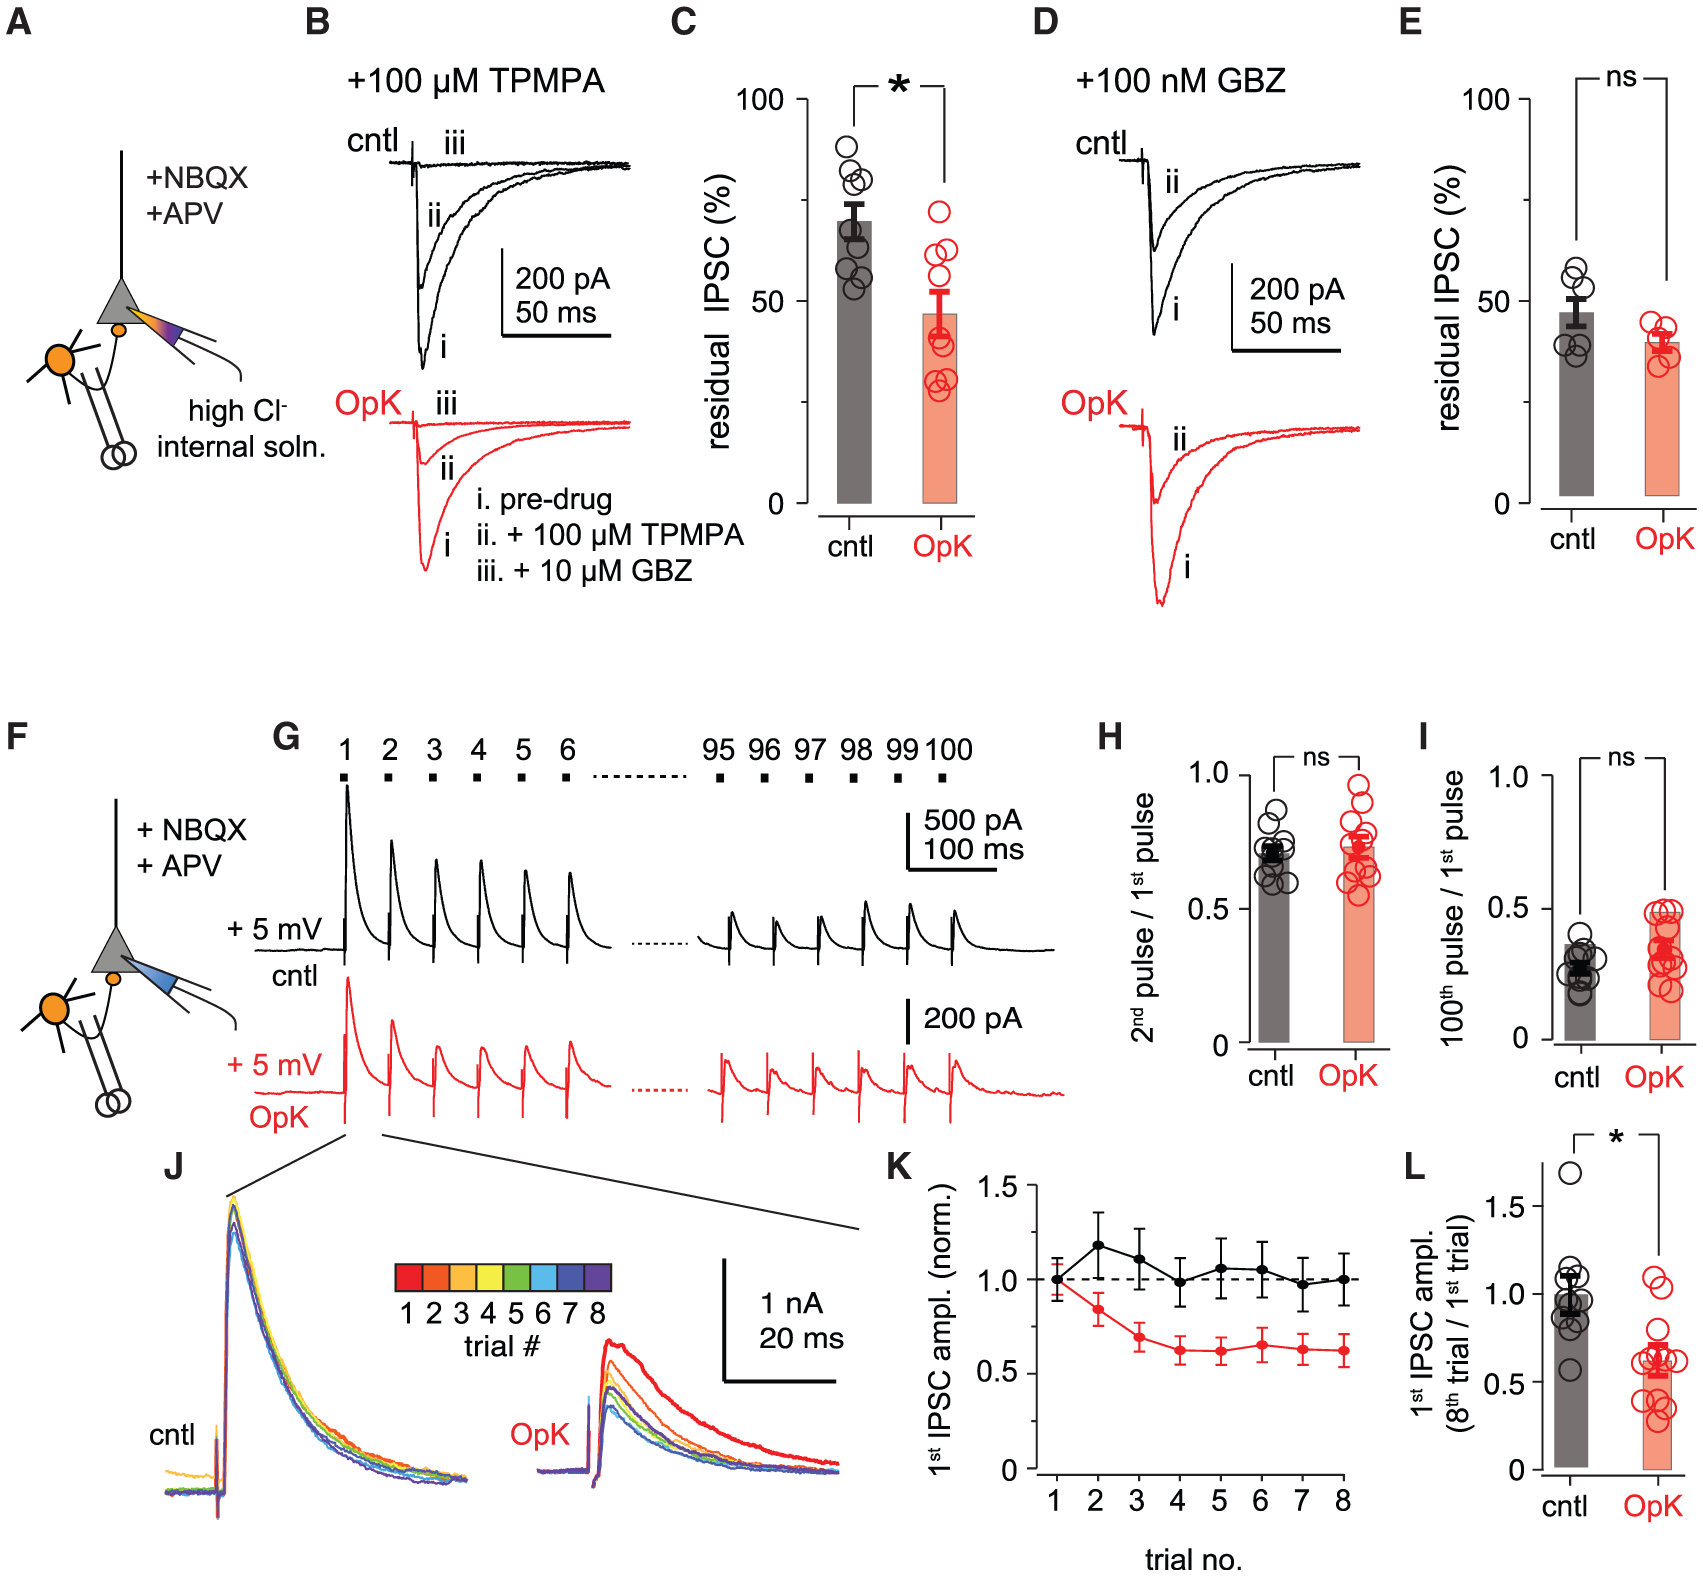
Figure 5. Optokindling decreases synaptic GABA concentration and slows vesicle refilling.

(A) Experimental schematic. Direct IPSCs were evoked by electrically stimulating at the layer II/III boundary ~250 μm from the recorded cell with excitatory synaptic transmission blocked. Responses were recorded (Vm = −70 mV) with a high-chloride pipette solution, resulting in inward IPSCs.
(B) Example IPSCs from a cntl mouse (black traces on top) and an OpK mouse (red traces on bottom) in regular artificial cerebrospinal fluid (aCSF) (i), after addition of 100 μM TPMPA (ii), followed by addition of 10 μM GBZ (iii).
(C) Summary of residual IPSCs after addition of 100 μM TPMPA.
(D) Example IPSCs from a cntl mouse (black traces on top) and an OpK mouse (red traces on bottom) in regular aCSF (i), after addition of 100 nM GBZ (ii).
(E) Summary of residual percentage of IPSCs after addition of 100 nM GBZ.
(F) Schematic for experiments, as in (A), except responses were recorded (Vm = +5 mV) with a regular Cs-gluconate pipette solution, resulting in outward IPSCs.
(G) Example responses following 100 stimuli at 20 Hz in a cntl (top) and OpK (bottom) mouse. Traces represent averages of 8 sequential trials presented 30 s apart. Stimulus artifacts have been truncated for clarity. Note the different vertical scale bars of cntl and OpK traces.
(H) Paired-pulse ratios (50-ms interstimulus interval) calculated as the ratio of the second over the first IPSC amplitude.
(I) Measure of vesicle depletion calculated as the ratio of the 100th over the first IPSC amplitude.
(J) Overlays of the first IPSCs within a trial for each of the 8 trials that are averaged in (G). The amplitudes across trials are constant in cntl slices (left), whereas there is a progressive decrease in amplitude in slices from OpK mice (right).
(K) Average first IPSC ratios across trials, normalized to the amplitude on the first trial (cntl, 11 cells/3 mice; OpK, 12 cells/3 mice).
(L) Ratios of first IPSC amplitudes for the first and eighth trials.
