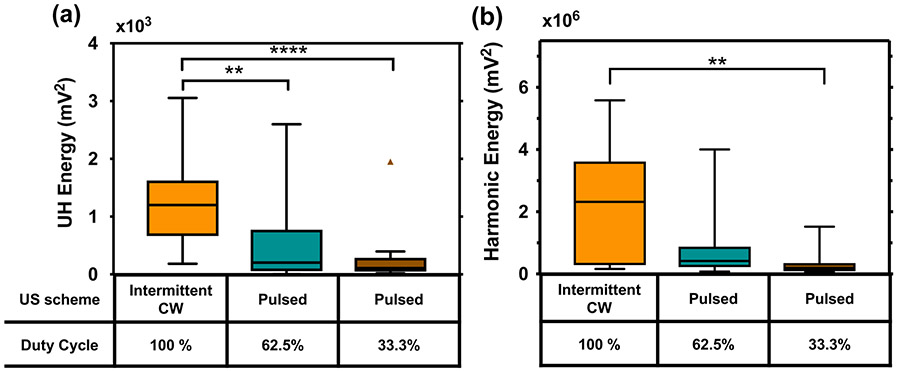
Figure 10.
(a) Ultraharmonic (UH) energy and (b) harmonic energy for the ultrasound (US) insonation schemes used in this study. Energy was summed over a frequency bandwidth of 4-kHz around the center frequency for the continuous wave (CW) US scheme and 50-kHz for the pulsed US. Ultraharmonics and harmonics were chosen based on frequencies below 2-MHz with a signal-to-noise ratio greater than 10 dB. Note the higher magnitude of energy in the harmonic frequencies. Statistical significance using a Kruskal-Wallis test is shown with brackets, where p < 0.05 is denoted by *, p < 0.01 is denoted by **, and p < 0.001 is denoted by ***. A Tukey boxplot is used where the boxes span the interquartile range and the bars span the data from maximum to minimum excluding any outliers. One outlier is present in the UH energy for 33.3% duty cycle pulsed US.

