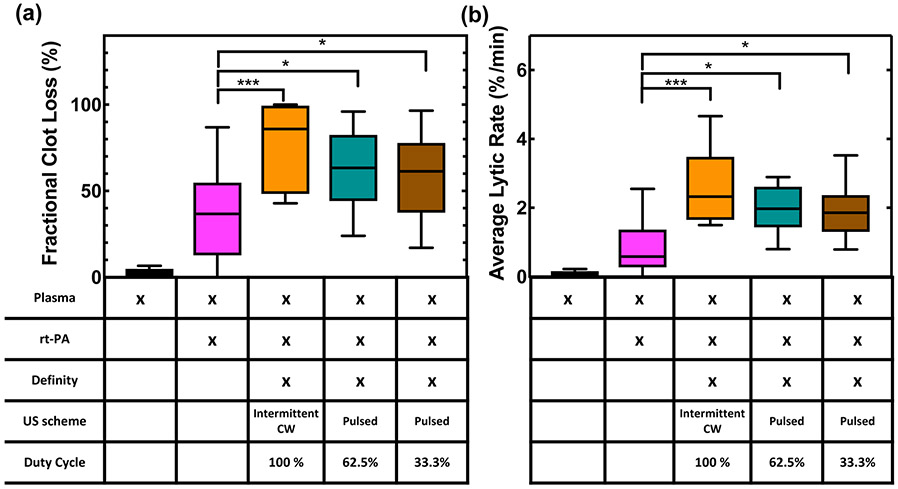
Figure 9.
(a) Fractional clot loss (FCL) and (b) average lytic rate (ALR) achieved with each treatment group. The recombinant tissue plasminogen activator (rt-PA) concentration was 3.15 μg/mL. All ultrasound (US) groups included plasma and rt-PA (3.15 μg/mL) and Definity® (2 μL/mL) in the presence of flow (0.65 mL/min). Statistical significance using a one-way ANOVA is shown with brackets, where p < 0.05 is denoted by *, and p < 0.001 is denoted by ***. N=16 for each group. The median value is given by the center line in each box. A Tukey boxplot is used where the boxes span the interquartile range and the bars span the data from maximum to minimum excluding any outliers.

