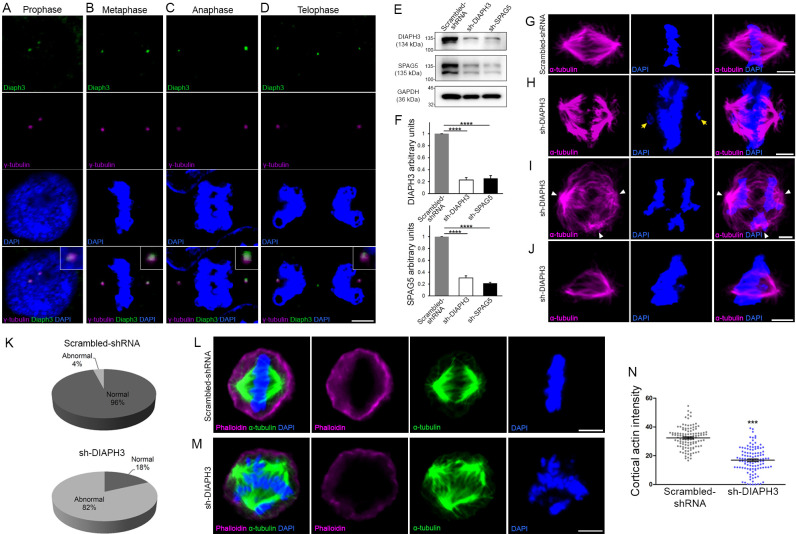
Figure 1. Loss of DIAPH3 disrupts the expression/stability of SPAG5 and causes mitotic defects.
(A–D) Immunostaining of U2OS cells at prophase (A), metaphase (B), anaphase (C), and telophase (D), with anti-DIAPH3 (green) and anti-γ tubulin (magenta). The chromosomes were counterstained with DAPI (blue). Diaphanous three (DIAPH3) localizes at the centrosome at all mitotic stages. Insets are zooms in the centrosomal region, showing that the DIAPH3 signal is pericentrosomal. Scale bar, 10 µm. n = 20 cells for each phase from three distinct experiments. (E, F) Western blot analysis of DIAPH3 and SPAG5 levels upon shRNA downregulation in U2OS cells. shRNA against DIAPH3 (sh-DIAPH3) significantly reduced the levels of DIAPH3 and SPAG5 proteins (p=0.000044 and 0.000046, respectively). Reciprocally, shRNA against SPAG5 (sh-SPAG5) reduced SPAG5 and DIAPH3 protein levels (p=0.000001 and 0.000097, respectively). Scrambled shRNA were used as control for the transfection and GAPDH as loading control. n = 3 independent experiments, Student’s t-test; error bars represent s.e.m. (G–J) Representative images of mitotic cells transfected with scrambled shRNA (G) and shRNA against DIAPH3 (sh-DIAPH3) (H–J), immunostained with anti-α tubulin (magenta). Chromosomes were counterstained with DAPI (blue). Yellow arrows in (H) point to lagging chromosomes. Arrowheads in (I) depict poles of mitotic spindle. (J) Representative image of a mitotic cell with disorganized/shrunk microtubule (MT), single centrosome/pole, and asymmetric metaphase plate. Scale bar, 5 µm. (K) Quantification of mitotic errors. 82% of DIAPH3 knockdown cells exhibit mitotic abnormalities (4% in control cells). n = 118 and 115 cells from five individual experiments of scrambled shRNA and sh-DIAPH3, respectively. (L–N) Diminished cortical actin in DIAPH3 knockdown cells. (L, M) Illustration of mitotic cells transfected with scrambled shRNA (L) or sh-DIAPH3 (M), and immunostained with phalloidin (magenta) and α-tubulin (green). Chromosomes were counterstained with DAPI; scale bar, 5 µm. (N) Quantification of cortical actin (fluorescence intensity) showing a reduction of 48% of cortical actin in DIAPH3 knockdown cells. n = 113 cells per condition from three distinct experiments. Student’s t-test, p=1.07 × 10⁻³². Error bars represent s.e.m.


