. 2021 Apr 26;10:e61974. doi: 10.7554/eLife.61974

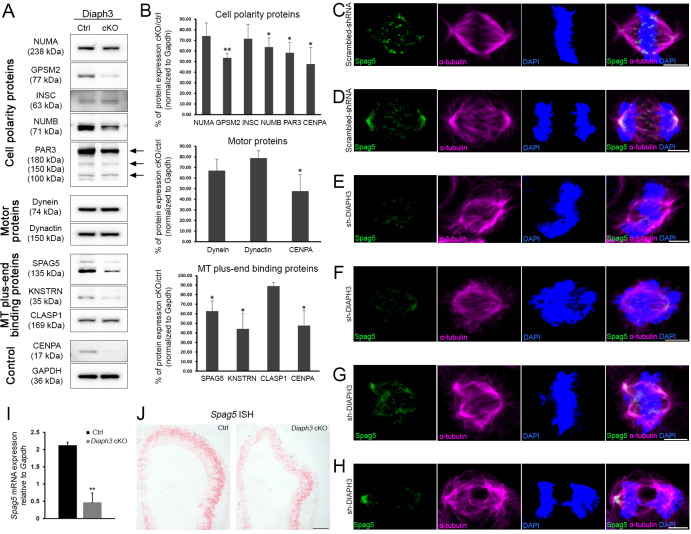
Figure 2. Diaph3 deficiency impairs the expression and stability of mitotic spindle polarity proteins.

(A, B) Assessment of nuclear mitotic apparatus (NUMA), G-protein signaling modulator 2 (GPSM2), INSC, NUMB, PAR3, Dynein, Dynactin, SPAG5, KNSTRN, and CLASP1 levels in telencephalon extracts of Diaph3 cKO embryos by western blotting. CENPA was used as positive control (Liu and Mao, 2016) and GAPDH as loading control for quantification. Both the higher and lower bands of SPAG5 were quantified. n = 4 embryos for each genotype. *p<0.05, ** p<0.01, Student’s t-test; error bars represent s.e.m. Fold change and p-value are listed in Supplementary file 2. (C–H) Representative images of mitotic cells transfected with scrambled shRNA (C, D) or DIAPH3 shRNA (sh-DIAPH3, E–H), and immunostained with anti-SPAG5 (green) and anti-α tubulin (magenta) antibodies. Chromosomes were counterstained with DAPI (blue). SPAG5 localized at the centrosome and kinetochore in control cells (C, D), and both its expression level and distribution were altered in DIAPH3 knockdown cells (E–H). Scale bar, 5 μm. n = 118 and 115 cells from five individual experiments of scrambled shRNA and sh-DIAPH3, respectively. (I) Quantification of the Spag5 mRNA by real-time RT-PCR. There is a reduction of 78% in Diaph3 cKO relative to control mice (p=0.0046). n = 3 from nine embryos for each genotype. (J) Coronal sections of e11.5 forebrain from control (left) and Diaph3 cKO (right, hybridized with a Spag5 fast red-labelled RNAscope probe). The expression of Spag5 mRNA is downregulated in Diaph3 cKO; scale bar, 150 µm. n = 3 for each genotype.

Figure 2—source data 1. Quantification of SPAG5 mRNA in DIAPH3 cKO cortex.

Figure 2.

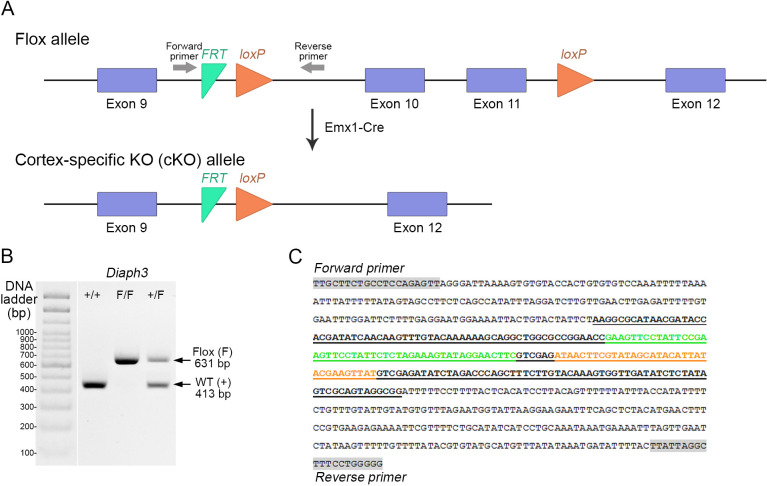
Figure 2—figure supplement 1. Generation of cortex-specific knockout (Diaph3 cKO) mice.

Figure 2—figure supplement 1.

(A) Schematic representation of the Diaph3 conditional allele. Two LoxP sites (orange arrowheads) were inserted in introns 9 and 11. Exons 10 and 11 were excised in the dorsal telencephalon by crosses with Emx1-Cre mice. (B, C) Genotyping of Diaph3 cKO mice. Forward and reverse primers, flanking the FRT-LoxP cassette in intron 9, amplified a fragment of 413 bp from the wildtype allele (+) and 631 bp from the Floxed (F) allele (B). (C) DNA sequence of the recombinant amplicon depicting the FRT (green), LoxP (orange), and PCR primers (grey boxes).
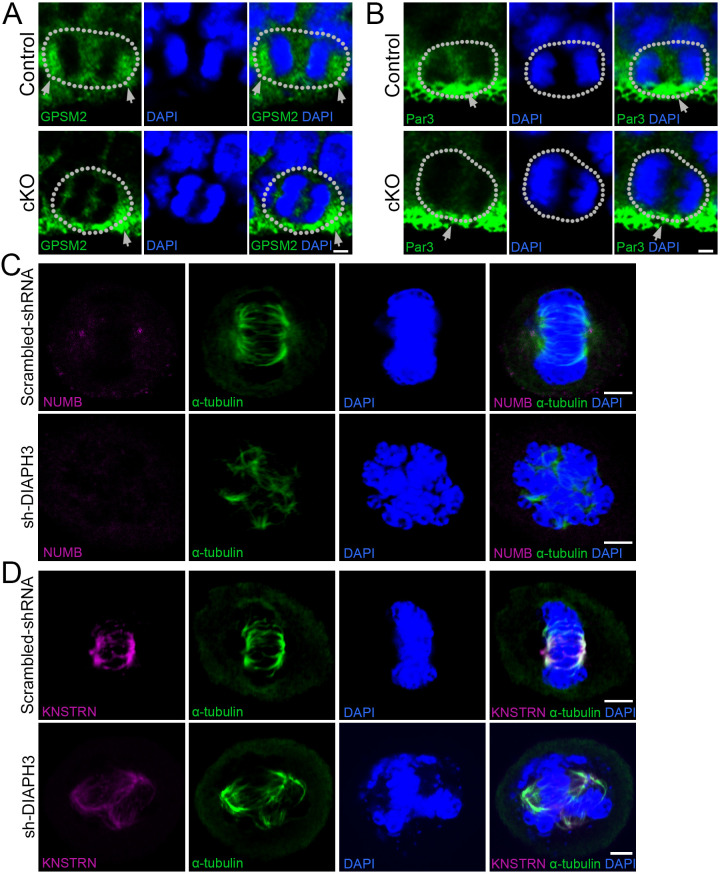
Figure 2—figure supplement 2. KO/KD of DIAPH3 disrupts the localization of cytocortical proteins.

Figure 2—figure supplement 2.

(A–B) Dividing apical neural progenitor cells (aNPCs) in telencephalic ventricular zone (VZ) stained with anti-GPSM2 (A) or anti-Par3 (B) antibodies (green) and DAPI (blue) to label chromosomes in control and Diaph3 cKO e12.5 cortical sections. (A) G-protein signaling modulator 2 (GPSM2) was concentrated in poles of dividing cells in control, but not in Diaph3 cKO (as indicated by the grey arrows). (B) Par3 was distributed in the apical side (grey arrow) in control, and this expression was reduced in Diaph3 cKO (as indicated by the grey arrow). Dotted line indicates the cell boundary. Scale bar, 2 µm. n = 20 cells from five individual experiments. (C) Immunostaining of scrambled shRNA and sh-DIAPH3 knockdown cells during mitosis with anti-α tubulin (green) and anti-NUMB (magenta). (D) Immunostaining of scrambled shRNA and sh-DIAPH3 knockdown cells during mitosis with anti-α tubulin (green) and anti-KNSTRN (magenta). Scale bar, 5 µm. n = 20 cells from five individual experiments.