. 2021 Apr 15;10:e67552. doi: 10.7554/eLife.67552

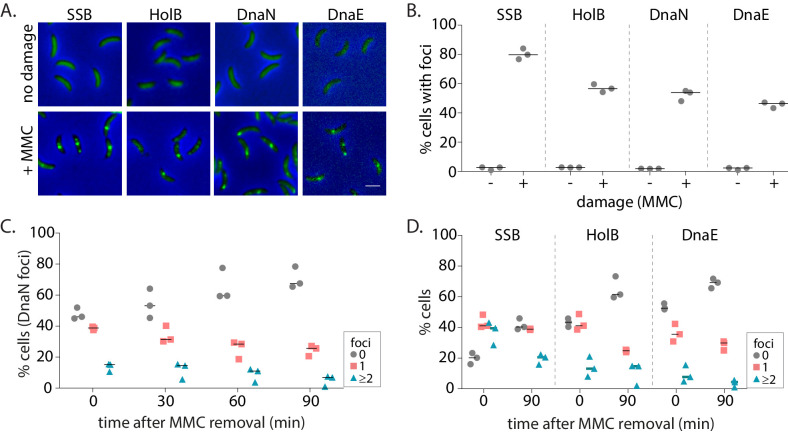
Figure 2. Replisome components are recruited to damaged DNA in non-replicating Caulobacter swarmer cells.

(A) Representative images of non-replicating swarmer cells with fluorescently tagged replisome components (SSB-YFP, HolB-YFP, DnaN-YFP, or DnaE-mNG) with (+MMC) or without (no damage) 30 min of treatment with MMC. (B) Percentage cells with SSB, HolB, DnaN, or DnaE localization (foci) in non-replicating swarmers with (+) or without (-) MMC treatment (n ≥ 324 cells, three independent repeats). Dashed line represents median here and in all other graphs. (C) Percentage swarmer cells with 0, 1, or ≥2 DnaN foci at 0, 30, 60, and 90 min after damage removal (recovery) (n ≥ 476 cells, three independent repeats). (D) Percentage swarmer cells with 0, 1, or ≥2 foci of SSB, HolB, or DnaE at 0 and 90 min after damage removal (recovery) (n ≥ 324 cells, three independent repeats).

Figure 2—source data 1. Source data related to panels in Figure 2.

Figure 2.

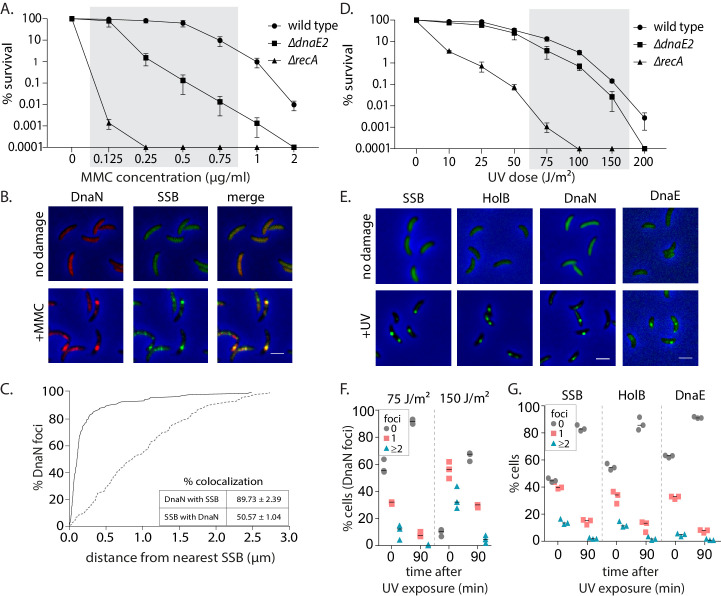
Figure 2—figure supplement 1. Replisome components are recruited to damaged DNA in non-replicating Caulobacter swarmer cells.

Figure 2—figure supplement 1.

(A) Survival of wild type, ∆dnaE2, and ∆recA strains under different doses of mitomycin C (MMC) (mean and SD from three independent experiments). Shaded region indicates the concentrations used for experiments in this study. (B) Representative images of swarmer cells expressing DnaN-mCherry and SSB-GFP with or without MMC treatment (scale bar is 2 µm here and in all other images). (C) Distance of a DnaN focus from the nearest SSB focus was measured and cumulative frequency distribution is plotted (solid line). Dotted line is the distribution of distance between the DnaN focus and any random position inside the cell. Inset: Percentage colocalization for DnaN with SSB and vice versa is provided (mean and SD from three independent repeats). (D) Survival of wild type, ∆dnaE2, and ∆recA strains under different doses of UV (mean and SD from three independent experiments). Shaded region indicates the concentrations used for experiments in this study. (E) Representative images of swarmer cells expressing SSB-YFP, HolB-YFP, DnaN-YFP, or DnaE-mNG with or without (no damage) UV treatment. (F) Percentage wild type swarmer cells with 0, 1, or ≥2 foci of DnaN at 0 and 90 min after DNA damage recovery from 75 J/m2 or 150 J/m2 of UV (n ≥ 322 cells, three independent repeats). (G) Percentage wild type swarmer cells with 0, 1, or ≥2 foci of SSB, HolB, or DnaE at 0 and 90 min after DNA damage recovery from 75 J/m2 of UV (n ≥ 334 cells, three independent repeats).
Figure 2—figure supplement 1—source data 1. Source data related to panels in Figure 2—figure supplement 1.