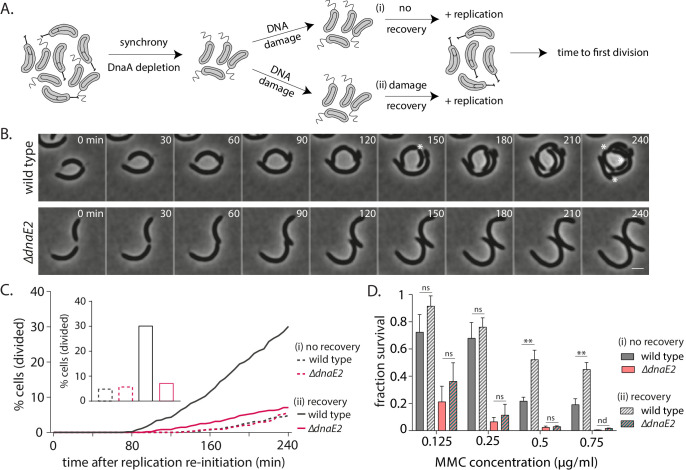
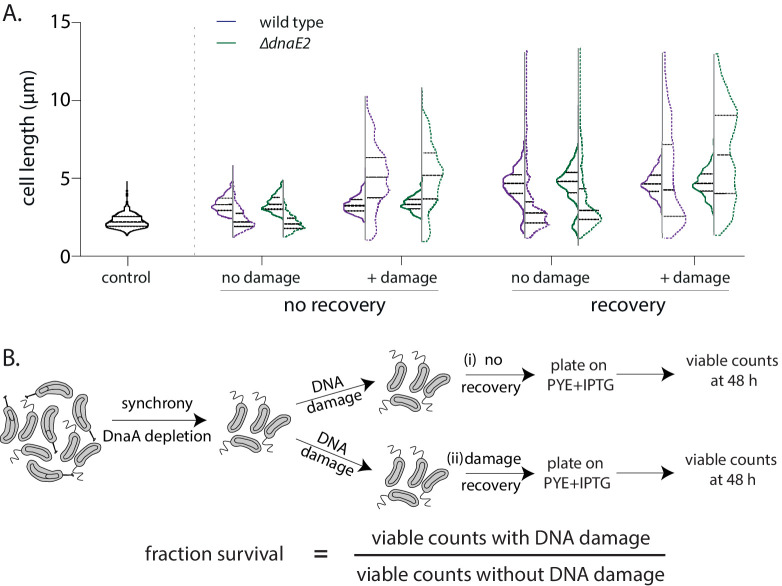
Figure 5. DnaE2 activity on nucleotide excision repair (NER)-generated long single-stranded DNA (ssDNA) gaps enhances survival of non-replicating cells under DNA damage.
(A) Schematic of experimental setup used to assess the impact of lesion repair/ tolerance in non-replicating cells. After mitomycin C (MMC) treatment for 30 min, cells were either released into replication-permissive media (i: no recovery) or allowed to grow for 90 min without damage and then released into replication-permissive media (ii: damage recovery). Cells were followed via time-lapse microscopy and time to division was estimated. Control cells were taken through the same growth regimes; however, no damage is added to the culture. (B) Representative time-lapse montage of wild type or ∆dnaE2 cells in replication-permissive media after DNA damage recovery. Cell divisions are marked with white asterisk. In the panel shown here, three divisions were scored in wild type, while none were observed in ∆dnaE2 cells. (C) Percentage cell division over time after replication reinitiation for wild type and ∆dnaE2 cells either without (i: no recovery) or with (ii: recovery) damage recovery time in replication-blocked conditions (n ≥ 368 cells). Inset: Percentage cells divided at 240 min in each of these conditions is summarized. (D) Survival of wild type and ∆dnaE2 cells either without (i: no recovery) or with (ii: recovery) damage recovery time in replication-blocked conditions was measured via estimation of viable cell count (three independent repeats). Fraction survival was calculated by normalizing viable cell count under DNA damage to that without DNA damage (mean with SD from three independent experiments).


