
Figure 3. Immunologic neutralization fully rescues the metabolic effects of viral induction of plasma asprosin.
(a) Body weight change was measured over 15 days after 12-week-old male C57Bl/6 mice were tail-vein-injected with Ad-empty or Ad-FBN1 (3.6 × 10⁹ pfu/mouse, n = 12/group) viruses. Downward arrow indicates the day of mAb treatment described below. (b–d) Cumulative food intake, body weight change, and blood glucose were measured 24 hr after intra-peritoneal injection of indicated control, isotype-matched IgG, or anti-asprosin mAbs (n = 6/group) in the above mice. (e) Body weight change was measured over 15 days after 12-week-old male C57Bl/6 mice were tail-vein-injected with Ad-empty or Ad-asprosin (5 × 10¹⁰ pfu/mouse, n = 12/group) viruses. Downward arrow indicates the day of mAb treatment described below. (f–h) Cumulative food intake, body weight change, and blood glucose were measured 24 hr after intra-peritoneal injection of indicated control, isotype-matched IgG or anti-asprosin mAb (n = 6/group) in the above mice. (i) Body weight change was measured over 60 days after 12-week-old male C57Bl/6 mice were tail-vein-injected with AAV8-empty or AAV8-asprosin (1 × 10¹² GC/mouse, n = 10/group) viruses. Downward arrow indicates the day of mAb treatment described below. (j–l) Cumulative food intake, body weight change, and blood glucose were measured 24 hr after intra-peritoneal injection of indicated control, isotype-matched IgG, or anti-asprosin mAbs (n = 5/group) in the above mice. Different and same alphabets on bars indicate presence or absence of significant difference, respectively, between groups, as determined by one-way ANOVA followed by Dunnett’s multiple comparisons test. p<0.05 was considered statistically significant (Figure 3—source data 1).

Figure 3—figure supplement 1. Viral overexpression of human asprosin results in a MS-like phenotype in lean mice.
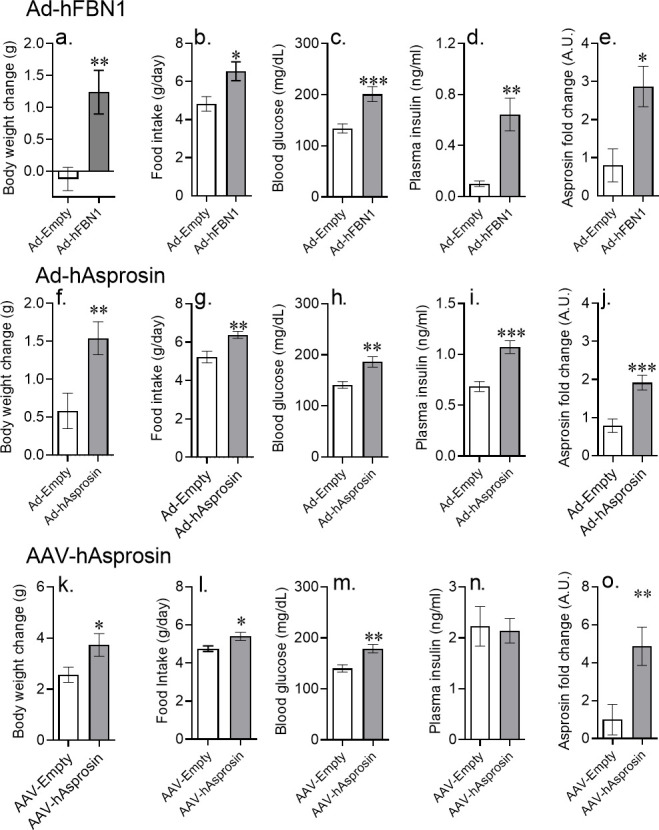
Figure 3—figure supplement 2. Raw body weight values of Ad5 and AAV experiments.
