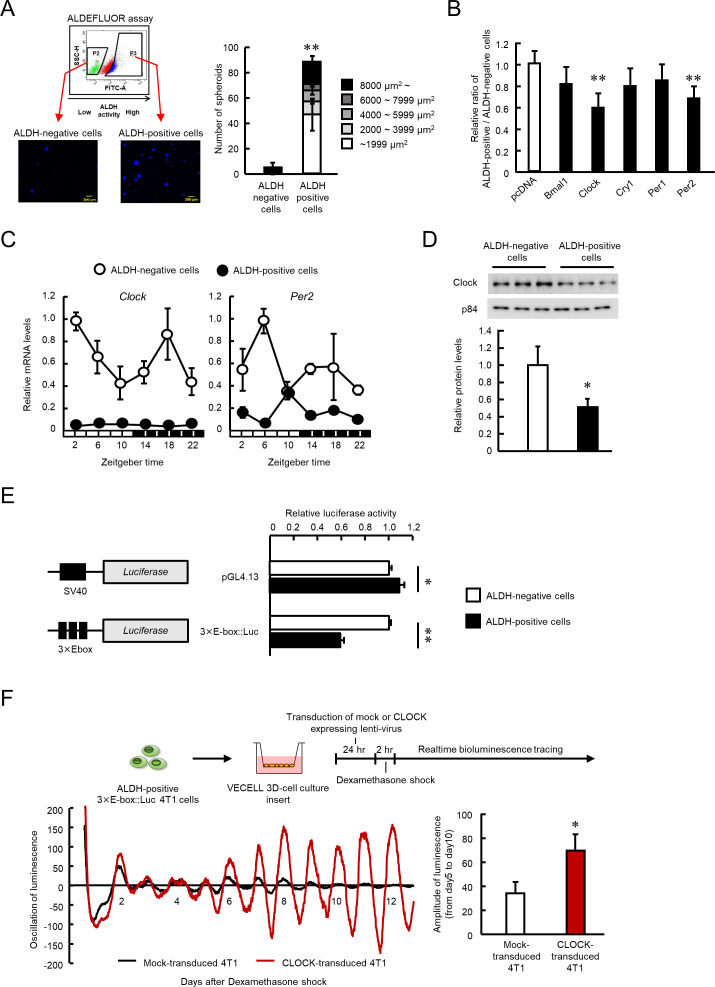
Figure 1. The role of CLOCK in the regulation of ALDH activity in 4T1 mouse breast cancer cells.
(A) Representative photograph of Hoechst-stained tumor spheroids of ALDH-negative or -positive 4T1 cells in agarose. Values are the mean with SD (n = 3). **p<0.01; significant difference from ALDH-negative cells (t6 = 12.598, Student's t-test). (B) Influence of each clock gene expression vector on the ratio of ALDH positive- to negative-cell populations. ALDH-positive 4T1 cells were cultured on 3D scaffold chambers after being transiently transfected with each expression vector using electroporation. ALDH activity was evaluated 5 days after transfection. Values are the mean with SD (n = 6). The mean value of the pcDNA group is set at 1.0. **p<0.01; significant difference from the pcDNA group (F5,30 = 6.807, p<0.001, ANOVA, Dunnett’s post hoc test). (C) The temporal mRNA expression profiles of Clock and Per2 in ALDH-positive and ALDH-negative cells isolated from 4T1 tumor-bearing mice kept under the light/dark cycle (zeightgber time 0. lights on ; zeitgeber time 12. lights off). Values are the mean with SD (n = 3). Data were normalized by β-Actin mRNA levels. (D) Difference in the expression levels of CLOCK protein between ALDH-negative and -positive 4T1 cells. The value of ALDH-negative cells is set at 1.0. Values are the mean with SD (n = 3). *p<0.05; significant difference between two groups (t4 = 3.915, Student’s t-test). (E) Difference in the promoter activities of E-box-driven luciferase reporter in ALDH-negative and -positive 4T1 cells. pGL4.13 or 3 × E-box::Luc reporter vectors were transfected into 4T1 cells, and luciferase assay was performed after cell sorting. Values are the mean with SD (n = 3). The value of ALDH-negative cells is set at 1.0. **p<0.01, *p<0.05; significant difference between two groups (t4 = 2.941 for pGL4.13, t4 = 43.287 for 3 × E-box::Luc, Student’s t-test). (F) The influence of lenti-viral CLOCK transduction on the circadian oscillation of E-box-driven luciferase bioluminescence. Top panel shows the scheme of experimental procedure. Bottom panels show real-time bioluminescence tracing of luciferase activity after dexamethasone synchronization (left) and mean of amplitude of bioluminescence oscillation from day 5 to day 10 after synchronization (n = 3) (right). *p<0.05; significant difference between two groups (t4 = 3.691, Student’s t-test).


