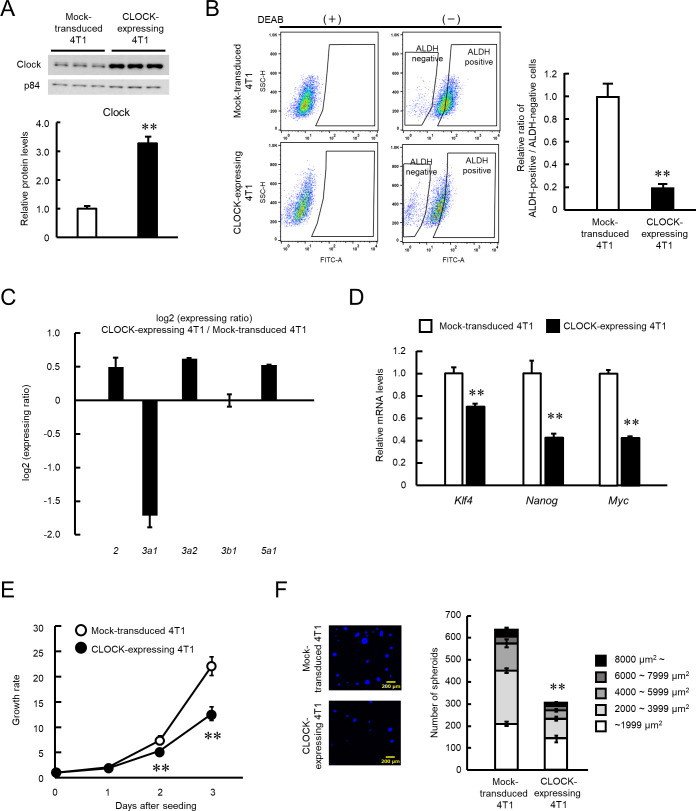
Figure 2. Suppression of stemness properties of 4T1 cells by CLOCK.
(A) CLOCK protein levels in mock-transduced and Clock-expressing lentivirus-infected 4T1 cells. Values show mean with SD (n = 3). **p<0.01; significant difference from mock-transduced 4T1 cells (t4 = 15.736, Student’s t-test). (B) The flow cytometric analysis of ALDEFLUOR assay of CLOCK-expressing 4T1 cells. The population of ALDH-positive cells was defined based on each DEAB group, whose means of fluorescence intensity were set almost the same. The right panel shows the difference in the ratio of ALDH positive- to negative-cell populations between mock-transduced and CLOCK-expressing 4T1 cells. Values show the mean with SD (n = 6). **p<0.01; significant difference from mock-transduced 4T1 cells (t10 = 22.455, Student’s t-test). (C) Difference in the mRNA levels of ALDH isoforms between mock-transduced and CLOCK-expressing 4T1 cells. Values show the mean with SD (n = 3). (D) The mRNA levels of stemness-related genes in ALDH-positive mock-transduced and CLOCK-expressing 4T1 cells. Data were normalized by the18s rRNA levels. Values show the mean with SD (n = 3). The values of the mock-transduced group are set at 1.0. **p<0.01: significant difference from mock-transduced 4T1 cells (t4 = 9.261 for Klf4; t4 = 8.001 for Nanog; t4 = 32.576 for Myc; Student’s t-test). (E) Difference in growth ability between mock-transduced and CLOCK-expressing 4T1 cells. Values show the mean with SD (n = 5–6). Cell viability of seeding day (day 0) are set at 1.0. **p<0.01; significant difference between from mock-transfected 4T1 cells at corresponding time points. (F7, 38 = 425.953, two-way ANOVA with the Tukey–Kramer test). (F) Difference in the spheroid formation ability between mock-transduced and CLOCK-expressing 4T1 cells. The left panel shows a representative photograph of the Hoechst-stained spheroids formed by mock-transduced or CLOCK-expressing 4T1 cells. The right panel shows the number of spheroid and the parcellation of the diameter. Values show the mean with SD (n = 3). **p<0.01; significant difference from mock-transduced 4T1 cells (t4 = 27.067, Student’s t-test, for number of spheroids).


